Sonographic-Pathologic
Correlation
Susan P.
Weinstein, Emily F.
Conant, Carolyn Mies,
Geza Acs,
Steven Lee,
and Chandra
Sehgal, JUM January 1, 2004 vol. 23 no. 1 73-83
Abstract
Objective. To show a variety of benign breast lesions that exhibit posterior acoustic shadowing on sonography. Methods. The cases illustrate a variety of pathologic breast conditions that were collected at a referral breast center at a tertiary medical center. Results. A variety of pathologic conditions are discussed, with pathologic-imaging correlation. Conclusions. Although posterior acoustic shadowing is a sonographic feature that is most commonly associated with mammary malignancies, this sonographic finding may also be seen with benign breast lesions.
Breast
sonography has become an indispensable tool in the evaluation of breast lesions.
Although breast sonography may play many different roles in breast imaging,
perhaps one of the more important roles it plays is in lesion characterization.
There are sonographic criteria that help guide in differentiating benign
lesions from questionable ones that need to undergo biopsy. Some of the typical
sonographic features of breast carcinoma include irregular margins, a long axis
perpendicular to the skin, a heterogeneous echo texture, and posterior acoustic
shadowing.1,2 Although 1 or more of these
sonographic features may be seen with breast carcinoma, it is important to note
that there is an overlap of the sonographic features, and some of these
sonographic findings may be seen with benign breast lesions.
In this
article, we present a spectrum of benign lesions that exhibit posterior
acoustic shadowing. Although some benign lesions cannot be distinguished from
malignant lesions on the basis of sonography alone, many of the lesions may be
accurately diagnosed on the basis of a combination of sonography, mammography,
and history. If biopsy is necessary, with the increased use of percutaneous
breast biopsies, understanding the overlap in the sonographic appearance of
benign and malignant lesions is particularly important when assessing
concordance of the imaging appearance with the pathologic results.
Materials
and Methods
Cases
showing a wide variety of pathologic breast conditions were collected from a
busy breast imaging center. The cases were evaluated by mammography and
sonography. All the cases had various benign breast conditions that exhibit
posterior acoustic shadowing on breast sonography.
Shadowing Lesions
Fibroadenomas
Fibroadenomas
are perhaps the most common solid breast masses that undergo biopsy. They may
vary greatly in size from microscopic masses to lesions that are larger than 10
cm. Fibroadenomas arise from the terminal ductal lobular unit. The usual
fibroadenoma is composed of a benign neoplastic proliferation of stroma
balanced by the expansion and stretching of non-neoplastic ductules. It forms a
sharply circumscribed mass with an expansile character that compresses adjacent
mammary parenchyma. As a consequence of generalized mammary involution,
fibroadenomas in postmenopausal women often show atrophy, hyalinizing
sclerosis, and calcification.
Typically
on sonography, fibroadenomas are well circumscribed and have an ovoid or
lobular shape. The internal architecture may vary from homogeneous to
heterogeneous3 on sonographic evaluation. Once
the fibroadenoma begins to undergo hyalinization, posterior acoustic shadowing
may be seen (Figure 1⇓). Up to 30% of noncalcified fibroadenomas
may exhibit posterior acoustic shadowing.1 This sonographic shadowing may be
confusing to the imager if not recognized as part of a spectrum of sonographic
findings of hyalinized fibroadenomas. In some cases, the shadowing is seen from
the margin of the lesion, giving a slightly different appearance than the more
typical central shadowing of cancer. Additionally, the degree of shadowing does
not appear to be as dense as in the case of some malignancies that exhibit this
characteristic, and the posterior wall of the fibroadenoma is often visible as
a thin echogenic margin, as shown in our example.

Figure 1.
Biopsy-proved fibroadenoma in
a 57-year-old woman. A, Sonogram showing a hypoechoic nodule with posterior
acoustic shadowing. The echogenic sharp posterior margin of the mass (arrow) is
shown through the region of shadowing. Typically, the posterior margin is not
visible in malignancies that have posterior acoustic shadowing. B, Medium-power
view showing a fibroadenoma with hyalinized stroma. The lesion is well
circumscribed (original magnification ×100). The epithelium shows mild
hyperplasia without atypia. The stroma shows scant cellularity composed of
abundant collagen material and bland spindled stromal cells.
Granular
Cell Tumors
Granular
cell tumors are uncommon neoplasms that may arise at any anatomic site; 16%
occur in mammary parenchyma or associated soft tissue.4 Granular cell tumors, first called
“granular cell myoblastoma,” are now known to express markers of neural
(Schwann cell) differentiation. Although nearly always benign in behavior, they
can mimic breast malignancies both clinically and on imaging evaluation. On
physical examination, they are palpably firm and, because of an infiltrative
character, may become fixed to surrounding tissue and may cause skin retraction
or dimpling.5 Local wide excision is the therapy
of choice given the infiltrative and locally aggressive nature of these benign
lesions.
At
pathologic review, sheets and clusters of bland tumor cells are seen. The tumor
cells are characterized by bland uniform nuclei with evenly distributed
chromatin and conspicuous nucleoli and abundant granular eosinophilic
cytoplasm.6 There should be a lack of mitotic
activity in the lesion.6
Mammographically,
an irregular spiculated mass may be seen,4 as shown in Figure 2⇓, although circumscribed masses also have
been described.5 Sonographically, a hypoechoic mass
with posterior acoustic shadowing is often seen.5 The sonographic image shows an
echogenic interface anterior to the hypoechoic lesion.

Figure 2.
Granular cell tumor in a
25-year-old woman. A, Sonogram showing an irregular mass with posterior
acoustic shadowing. B, Pathologic specimen showing a stellate-shaped, 0.8-cm
mass that arose in a very fatty region of the breast (original magnification
×200). The microscopic pattern is typical: cytologically bland-appearing cells
with abundant granular cytoplasm and petite nuclei (arrows) embedded in a dense
fibrous stroma. There is a lack of mitotic activity. These features are
consistent with the diagnosis of a granular cell tumor. There was subtle spiny
infiltration of fat at the periphery, but there was no necrosis or mitotic
activity.
Radial
Scars
Radial
scars are common, seen in up to 28% of mastectomy and large excisional biopsy
specimens. Most are microscopic, multiple, and scattered, but some merge into a
confluent mass-forming aggregate. Solitary larger (≥1.0-cm) examples may form a
palpable mass or one that appears as a discrete lesion on a mammogram. Radial
scars are benign lesions of unknown etiology that can mimic a malignancy on
imaging and pathologic evaluation.
Mammographically,
these lesions show spicules originating from a central nidus (Figure 3⇓). Unlike a carcinoma, with spicules
originating from a central mass, the radial scar does not have a central mass
but rather has a central area of architectural distortion.7 At times, there may be fat
entrapped in the central nidus, resulting in an area of lucency, which may
suggest the diagnosis of a radial scar.7 At pathologic evaluation, the
characteristic feature is a central fibroelastotic area, which is surrounded by
distorted ducts in a stellate pattern.8 The microscopic appearance may
vary depending on the amount of sclerosis, epithelial proliferation, and ductal
distortion and entrapment.8 Unlike a typical invasive ductal
carcinoma, a radial scar may vary in appearance greatly depending on the
mammographic projection.

Figure 3.
Radial scar in a 38-year-old
woman. A, A spiculated mass is shown on a spot magnification view in the craniocaudal
position. B, Sonogram showing a small hypoechoic mass with dense posterior
acoustic shadowing. There is suggestion of spiculations arising from the
hypoechoic mass. A radial scar was suspected on the basis of the patient’s
mammographic and sonographic findings. Gross examination of the tissue showed
it to be predominantly fibrous in character, with a firm 0.3-cm nodule at the
radiologically identified site. C, This nodule corresponds to a fibroelastotic
center (arrow) from which radiates a corona of connective tissue bands and
stretched terminal duct-lobular units, typical of a radial scar (original
magnification ×25). Some of the small ducts are cystically dilated because of
local obstruction by this fibrosing process.
At
sonographic evaluation, a hypoechoic mass with dense posterior acoustic
shadowing may be seen. There are no sonographic features that would distinguish
this from a malignancy.9 The combination of the
mammographic and sonographic features may suggest the diagnosis. Even though
imaging features may suggest the diagnosis of a radial scar, biopsy is
recommended because a definitive diagnosis may not be made on the basis of the
imaging findings alone. Excisional biopsy, rather than core needle biopsy, is
recommended because of the risk of associated lesions with this entity, such as
atypical ductal hyperplasia, intraductal carcinoma in situ, lobular neoplasia,
and tubular carcinoma.10
Diabetic
Mastopathy
Diabetic
mastopathy was first described in the context of thyroiditis and arthropathy in
1984 by Soler and Khardori.11 It is an uncommon condition
occurring in patients with long-standing diabetes mellitus, although similar
pathologic findings occur in nondiabetic persons. It is most often diagnosed in
premenopausal women. Patients usually have a poorly defined, firm-to-hard,
nontender breast mass that can mimic carcinoma. The size may vary considerably
from millimeters to several centimeters.12
Mammographically,
a mass is often not seen because of the presence of dense breast tissue.
Therefore, sonography is helpful in characterizing the breast mass. At
sonographic evaluation, an irregular hypoechoic mass with posterior acoustic
shadowing may be seen (Figure 4⇓). Given the clinical history and the
sonographic features, the diagnosis of diabetic mastopathy may be suggested,
but tissue diagnosis is recommended for confirmation.

Figure 4.
Diabetic mastopathy in a
37-year-old woman with a 17-year history of insulin-dependent diabetes
mellitus. On physical examination, a mobile 3-cm mass was palpated within the
left upper inner quadrant. The patient’s mammogram showed dense breast tissue
without a focal mammographic abnormality. A, Sonogram showing a poorly
marginated mass with posterior acoustic shadowing. Biopsy revealed diabetic
mastopathy. B, Medium-power view showing dense, keloidlike fibrosis and a
perilobular chronic inflammatory infiltrate composed of small lymphocytes
(original magnification ×100). Scattered epithelioid myofibroblasts are also
present. The combination of these histologic features is consistent with
diabetic mastopathy.
At
gross pathologic evaluation, a discrete mass is usually palpable without being
visible. The mass is caused by the dense hyalinized collagenization of
intralobular and interlobular stroma populated by sparse enlarged, epithelioid
fibroblasts and myofibroblasts; a ductocentric and lobulocentric lymphocytic
infiltrate is often, but not invariably, seen.4,11
Fat
Necrosis
Fat
necrosis is a benign condition related to prior trauma or surgery. The
condition is usually asymptomatic, although patients may have palpable breast
masses. The mammographic appearance may be varied depending partly on the
remoteness of the inciting event relative to the time of the imaging
evaluation. An irregular spiculated mass with or without calcifications,
calcifications alone, an oil cyst, or no findings may be seen at mammographic
evaluation. On sonography a hypoechoic mass with posterior acoustic shadowing
may be seen (Figure 5⇓). In the case of oil cysts, late in the
evolution of fat necrosis, a circumscribed hypoechoic mass with or without
posterior acoustic shadowing may be seen. The thin echogenic rim is usually
visible regardless of the presence of the shadowing. Other sonographic
appearances of fat necrosis include a complex mass with a mixed echo texture
and an intracystic soft tissue mass.13 Although the sonographic findings
may be quite alarming, the mammographic findings typically are benign appearing
and suggestive of the diagnosis (Figure 6⇓).

Figure 5.
Fat necrosis in a 43-year-old
woman who had a recent history of a left mastectomy and a right breast
reduction. The patient had a palpable right breast mass. The mammographic
examination revealed no questionable findings. A, Sonogram showing an area of
posterior acoustic shadowing. Given the clinical appearance and the sonographic
finding, the patient underwent an excisional biopsy, and the diagnosis of fat
necrosis was made. B, Medium-power view of fat necrosis showing chronic
inflammation composed of lymphocytes admixed with foamy macrophages and a giant
cell reaction (original magnification ×100).
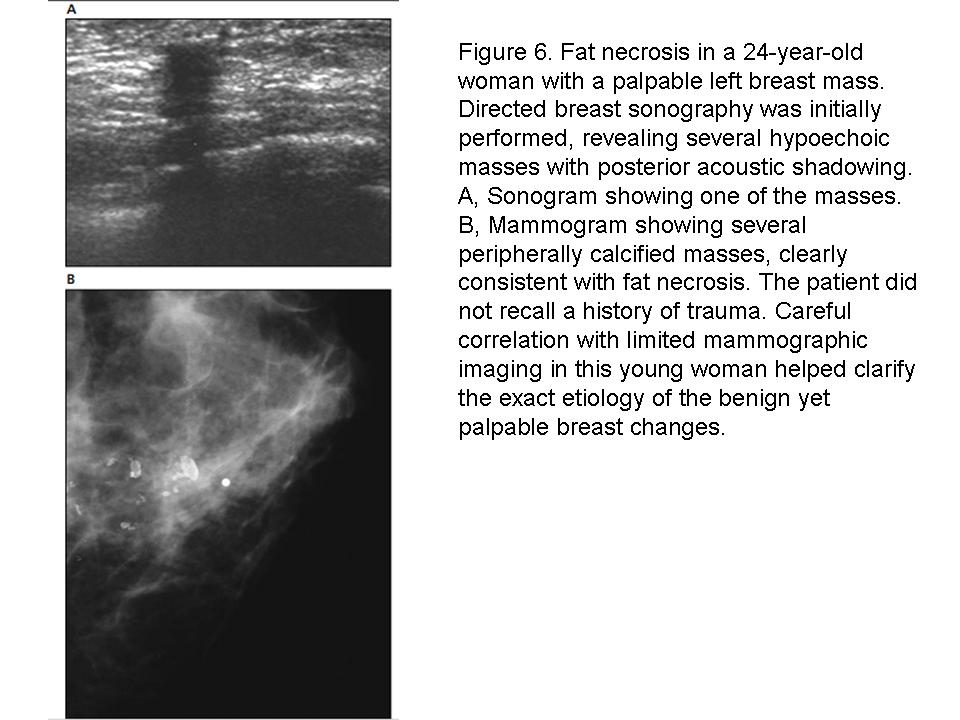
Figure 6.
Fat necrosis in a 24-year-old
woman with a palpable left breast mass. Directed breast sonography was
initially performed, revealing several hypoechoic masses with posterior
acoustic shadowing. A, Sonogram showing one of the masses. B, Mammogram showing
several peripherally calcified masses, clearly consistent with fat necrosis.
The patient did not recall a history of trauma. Careful correlation with
limited mammographic imaging in this young woman helped clarify the exact
etiology of the benign yet palpable breast changes.
The
histologic appearance of fat necrosis similarly varies with the age of the
process. Mass-forming lesions are characterized by lymphoplasmacytic
inflammation, foamy macrophages, foreign body-type giant cells, and reparative
fibrosis.
Postsurgical
Scars
After a
benign breast biopsy, the breast tissue usually heals without residual
perceptible changes. For patients who undergo breast conservation therapy for
cancer, there is an increased likelihood of distortion and scarring after
surgery and radiation therapy. These findings may be confusing if the
appropriate clinical history is not provided. Likewise, for patients who have
undergone benign excisional biopsy, the changes seen on the mammogram are
usually obvious given the appropriate clinical history, prior comparison films,
and even the images from the needle localization procedure. In cases when the
appropriate history is not available, a postsurgical scar may mimic a malignancy.
At
sonographic evaluation, an area of posterior acoustic shadowing may be seen.1 It has been our experience that
the shadowing associated with a scar often has shadowing without a central
mass. This lack of a central mass helps differentiate a scar from a carcinoma,
which has shadowing arising from a central mass. With scars, the degree of
posterior acoustic shadowing may be more prominent in certain planes than in
others, as in our example (Figure 7⇓). Occasionally, on sonography a
hypoechoic surgical plane margin may be seen extending from the surgical bed to
the skin surface.

Figure 7.
Postsurgical scar in a
57-year-old woman with a history of benign left breast biopsy. A and B,
Sonograms of the scar site showing dense posterior acoustic shadowing. During
dynamic scanning, no central mass was shown. The degree of posterior acoustic
shadowing is more prominent in the antiradial direction (A) than in the radial position
(B).
Focal
Fibrosis
Focal
fibrosis is a fairly common condition, accounting for as many as 9% of lesions
diagnosed on the basis of core needle biospy.14 It was first described as a
distinct entity by Haagensen,15 who noted its occurrence during
the reproductive years and speculated on a hormonal etiology. In fact, this
process may have several causes, regional or partial mammary involution
probably being the most common.16
Focal
fibrosis manifests with a range of mammographic and sonographic findings. The
mammographic findings include circumscribed masses, asymmetric densities,
architectural distortion, and irregular masses.14,17 Similarly, on sonography the
appearance may vary from circumscribed hypoechoic masses to questionable
hypoechoic masses with or without posterior acoustic shadowing and posterior
acoustic shadowing without definite masses.14,17 Examples of fibrosis are shown in
Figures 8⇓ and 9⇓. Pathologic studies of this entity differ
in only 1 respect: the character of the interface of the lesion with
surrounding breast. Most describe the process as forming a clinically dominant
mass that has microscopically indistinct margins; others say the mass is
discrete and sharply circumscribed.15,18 In fact, both configurations are
seen, in parallel with the range of imaging features. By definition, the
epithelial components of the fibrocystic change complex are absent. At
pathologic evaluation the key features include dense stromal fibrosis with
atrophy of ducts and lobules. A variable amount of chronic inflammatory
infiltrate may be present, composed of small lymphocytes.13

Figure 8.
Focal fibrosis in a
32-year-old woman with a palpable breast mass. The mammogram revealed dense
breast tissue without a questionable focal abnormality. A, Directed sonogram
over the palpable area of concern showing a hypoechoic region with posterior
acoustic shadowing. Excisional biopsy was performed, revealing fibrosis. B,
Pathologic examination revealed a discrete mass that was not grossly or
microscopically visible; the tissue was composed of paucicellular fibrous
tissue with completely atrophic parenchymal structures (original magnification
×100). Some fat is evident at the edges of the resected tissue as well as in
interposed wispy streaks and small pockets.

Figure 9.
Focal fibrosis in an
87-year-old woman with a palpable mass in the left breast. A, Craniocaudal mammograms
showing developing density (arrows) in the central breast, which was not seen
on a mammogram obtained 2 years earlier (B). C, Sonogram showing a poorly
defined hypoechoic area with posterior acoustic shadowing. Biopsy revealed
fibrosis. D, Medium-power view showing dense fibrosis with bundles of collagen
and bland spindled stromal cells (original magnification ×100). There is a
sparse chronic inflammatory infiltrate composed of small lymphocytes.
Sclerosing Adenosis
Sclerosing
adenosis is a component of the proliferative fibrocystic change complex that is
usually spotty but may coalesce to form a dominant mass on its own (so-called
adenosis tumor). It also may occur in the context of radial scars and
sclerosing papillomas to create a highly complex imaging and pathologic
picture. The condition typically manifests as a mammographic abnormality,
although rarely it may manifest as a palpable breast finding.19 The most common appearance on
mammography is a focal group of punctate or amorphous calcifications or a
regional cluster of powdery calcifications. However, sclerosing adenosis may
also appear as a nodule or a spiculated mass.20 Although there is limited
information on the sonographic evaluation of sclerosing adenosis, at
sonography, posterior acoustic shadowing may be seen,1,3 as shown in Figure 10⇓. The shadowing may be due to the fibrotic
response elicited by this entity.3

Figure 10.
Sclerosing adenosis in a
45-year-old woman with an area of architectural distortion in the upper outer
quadrant. A, Sonogram showing a vague hypoechoic area with posterior acoustic
shadowing (arrows). The degree of posterior acoustic shadowing is not as dense
as in carcinomas that have shadows. Wire localization biopsy showed irregularly
fibrotic breast tissue without a discrete mass. B and C, Microscopic specimens
showing a complex combination of proliferative fibrocystic changes dominated by
sclerosing adenosis and multiple microscopic radial scars forming confluent
nodules and bands of dense fibrosis (B and C, respectively, original
magnification ×50). Sclerosing adenosis consists of a micronodular
proliferation of small mammary acini with prominent spindling myoepithelial
cells and fibrosis. The fibrotic stroma compresses, elongates, and distorts the
acini.
At
pathologic evaluation, closely packed benign lobules are seen, composed of
distorted acini with surrounding fibrosis. The fibrotic stroma compresses,
elongates, and distorts the acini. The normal 2-cell layer of the ductules is
retained, although the myoepithelial cell layer is usually hyperplastic.7
Normal Breast Tissue
Real-time
sonographic evaluation of normal breast tissue may exhibit posterior acoustic
shadowing.1 Because the ultrasonic transducer
scans over the multiple tissue interfaces, such as Cooper ligaments and other
connective tissue, posterior acoustic shadowing may result. However, on
rescanning and dynamic imaging of the area, particularly in a different plane,
the shadowing may resolve or may appear less prominent. Additionally, because
the posterior acoustic shadowing is generated by interfaces, there should be no
associated mass. This example shows the importance of dynamic real-time
scanning in the evaluation of subtle breast lesions. Figure 11⇓ shows shadowing as an artifact that may
be seen in normal breast tissue.

Figure 11.
A, Sonogram of normal breast
tissue showing posterior acoustic shadowing. B, On reevaluation on the same
area, the shadowing is no longer seen.
Conclusions
Sonography
is an indispensable tool in the evaluation of breast abnormalities. Posterior
acoustic shadowing is a sonographic characteristic that is most commonly
associated with breast malignancies. However, it is important to keep in mind
that this sonographic finding may also be seen in benign breast masses. The
clinical history and mammographic findings, in conjunction with the sonographic
findings, will often lead to the correct diagnosis. If core needle biopsy is
performed on a lesion with posterior acoustic shadowing, it is important to
keep in mind that a specific benign diagnosis, such as a fibroadenoma or
diabetic mastopathy, may indeed be concordant with the imaging findings.
_________________________
_________________________
Bóng Lưng Phía Sau (Posterior Acoustic
Shadowing) của những Tổn Thương Tuyến Vú Lành Tính: Mối Tương Quan giữa Siêu Âm và Bệnh Học.Susan P. Weinstein, Emily F. Conant, Carolyn Mies, Geza Acs, Steven Lee, and Chandra Sehgal, JUM January 1, 2004 vol. 23 no. 1 73-83
BS LÊ THỊ QUỲNH NHƯ dịch
Tóm tắt
Mục tiêu. Cho thấy sự đa dạng của
những tổn thương tuyến vú lành tính có bóng lưng phía sau trên siêu âm. Phương
pháp. Những trường hợp minh họa cho sự đa dạng của bệnh lý tuyến vú được
thu thập từ khoa vú của một trung tâm y khoa loại ba. Kết quả. Sự đa dạng của
những tình trạng bệnh lý được đưa ra thảo luận, với sự tương đồng giữa hình ảnh
và bệnh học. Kết luận. Mặc dù bóng lưng phía sau là một đặc tính siêu âm thường
gặp ở những tổn thương vú ác tính, nhưng đặc điểm này cũng có thể gặp ở những tổn
thương lành tính.
Siêu âm vú đã trở thành một công cụ không thể thiếu được trong việc đánh
giá những tổn thương của tuyến vú. Mặc dù siêu âm vú đóng nhiều vai trò quan trọng
trong chẩn đoán hình ảnh, nhưng vai trò quan trọng nhất có lẽ là mô tả tổn
thương. Có nhiều tiêu chuẩn siêu âm có thể giúp ích cho việc chẩn đoán phân biệt
giữa những thương tổn lành tính và những thương tổn cần sinh thiết. Những đặc
điểm điển hình cho ung thư vú bao gồm bờ không đều, trục vuông góc với da, cấu
trúc echon hỗn hợp và bóng lưng phía sau. Chúng ta cần chú ý rằng có sự chồng
chéo lên nhau của những đặc tính siêu âm và vài đặc tính này có thể gặp ở những
tổn thương lành tính của tuyến vú.
Trong bài báo này, chúng tôi đưa ra một tập hợp những tổn thương vú lành
tính có sự xuất hiện của bóng lưng phía sau. Mặc dù vài tổn thương lành tính
không thể phân biệt với ác tính nếu chỉ dựa vào siêu âm, nhưng nhiều tổn thương
có thể được chẩn đoán chính xác dựa trên sự kết hợp của siêu âm với nhũ ảnh và
bệnh sử. Nếu việc sinh thiết là cần thiết thì việc hiểu được sự chồng chéo lên
nhau của những tính chất siêu âm giữa bệnh lý lành tính và ác tính là đặc biệt
quan trọng khi đánh giá sự tương đồng giữa hình ảnh và bệnh học.
Phương tiện và phương pháp
Những trường hợp thể hiện sự đa dạng của bệnh lý tuyến vú được thu thập từ
một trung tâm chẩn đoán hình ảnh tuyến vú đông bệnh nhân, được đánh giá bằng
siêu âm và nhũ ảnh. Tất cả đều có tổn thương tạo bóng lưng phía sau trên siêu
âm vú.
Những thương tổn tạo bóng lưng
U Sợi Tuyến
(fibroadenomas)
U sợi tuyến có lẽ là khối u vú thường gặp nhất được sinh thiết. Chúng có thể
thay đổi theo kích thước từ những khối cực nhỏ đến những u lớn hơn 10 cm. U sợi
tuyến xuất phát từ những đơn vị tiểu thùy tận, thông thường là một tập hợp của
khối mô đệm tăng sinh được cân bằng bởi sự lan rộng của những ống nhỏ. Nó tạo
thành một khối giới hạn rõ, có tính chất bành trướng gây chèn ép mô tuyến vú kế
cận. Kết quả của sự co nhỏ mô tuyến là u sợi tuyến ở phụ nữ đã mãn kinh thường
teo lại, xơ hóa hyalin và vôi hóa.
U sợi tuyến trên siêu âm thường có giới hạn rõ và có hình dạng oval hoặc
nhiều thùy, cấu trúc echo đồng nhất hoặc hỗn hợp. Khi u sợi tuyến bất đầu xơ
hóa, có thể thấy được hình ảnh bóng lưng phía sau (Hình 1). Đến 30% u sợi tuyến
không vôi hóa có hình ảnh bóng lưng sau. Hình ảnh này có thể gây nhầm lẫn cho
người làm siêu âm nếu không nhận ra đó là một phần của tập hợp những hình ảnh
siêu âm u sợi tuyến xơ hóa hyalin. Trong vài trường hợp, bóng lưng thấy ở bờ của
tổn thương, khác biệt nhỏ so với hình ảnh điển hình bóng lưng trung tâm của ung
thư. Thêm nữa, mức độ của bóng lưng không mạnh như trường hợp ác tính và bờ sau
của u sợi tuyến thường là một đường có hồi âm mỏng như trong ví dụ của chúng
tôi.
|
|
|
Hình 1.
U sợi tuyến đã được chứng
minh ở một phụ nữ 57 tuổi. A. Hình ảnh siêu âm cho thấy khối echo kém với
bóng lưng sau. Bờ sau rõ và có phản âm (mũi tên) thấy được trong vùng giảm âm
sau. Thông thường, bờ sau của u không thấy được ở tổn thương ác tính có bóng
lưng phía sau. B. Hình ảnh phóng đại thể hiện u sợi tuyến với mô đệm xơ hóa
hyalin. Tổn thương có giới hạn rõ (phóng đại 100 lần). Biểu mô cho thấy tăng
sinh nhẹ không có tế bào không điển hình. Mô đệm cho thấy ít cấu trúc tế bào
tạo bởi tế bào trung mô và collagen.
|
U tế bào hạt (granular cell
tumors)
U tế bào hạt là những tổn thương tân sinh ít gặp, có thể xuất phát từ bất
kì vị trí nào, 16% xuất hiện ở mô tuyến vú hoặc là mô mềm xung quanh. Mặc dù gần
như luôn luôn thể hiện là tổn thương lành tính, chúng có thể biểu hiện giống
ung thư kể cả về lâm sàng cũng như về mặt hình ảnh. Trong khám lâm sàng, có thề
sờ thấy khối cứng, có thể dính với mô xung quanh và gây co rút hay lõm da. Cắt
rộng sẽ là phương pháp được lựa chọn cho những tổn thương lành tính có thâm nhiễm
và xâm lấn xung quanh như thế này.
Trong hình ảnh của giải phẫu bệnh, những dải và những đám tế bào u nhuộm
màu nhạt được tìm thấy. Tế bào của khối u được nhận ra bởi nhân bắt màu nhạt đồng
dạng với nhiễm sắc thể phân bố đều, nhân dễ thấy và tế bào chất nhuộm eosin
giàu hạt. Thường không có hoạt động phân bào trong tổn thương.
Trên nhũ ảnh, có thể thấy một khối không đều hình dạng gai, như trong Hình
2, mặc dù vậy cũng có thể thấy những khối có giới hạn rõ. Trên siêu âm, thường
thấy một khối giảm âm với bóng lưng phía sau. Hình ảnh siêu âm cho thấy bờ trước
đồng âm so với tổn thương giảm âm.
|
|
|
Hình 2.
U tế bào
hạt ở phụ nữ 25 tuổi. A, Hình ảnh siêu âm cho thấy khối bờ không đều với bóng
lưng sau. B, Phóng đại cho thấy một khối hình sao 0.8 cm xuất phát từ vùng rất
nhiều mô mỡ của vú (phóng đại 200 lần). Dạng mô học đặc trưng: những tế bào bắt
màu nhạt với tế bào chất nhiều hạt và nhân nhỏ (mũi tên) gắn vào mô sợi dày.
Không có hoạt động phân bào. Những tính chất này là chắc chắn để chẩn đoán u
tế bào hạt. Có sự thâm nhiễm mô mỡ nhẹ dạng gai vùng ngoại biên nhưng không
có hoại tử và hoạt động phân bào.
|
Sẹo Hình Sao (Radial Scars)
Sẹo hình sao thường gặp, thấy trong 28% trường hợp mổ lấy u và sinh thiết cắt
rộng. Chủ yếu là những cấu trúc vi mô, phức tạp hoặc phân tán nhưng trong vài
trường hợp chúng kết hợp với nhau tạo thành khối. Những trường hợp sẹo rắn lớn
(hơn 1 cm) có thể tạo thành khối sờ thấy hoặc những tổn thương rời rạc trên nhũ
ảnh. Sẹo hình sao là những tổn thương lành tính chưa rõ nguyên nhân và rất giống
với tổn thương ác tính trên hình ảnh và trong hình ảnh mô học.
Nhũ ảnh cho thầy hình ảnh những gai tỏa ra từ nơi xuất phát trung tâm (Hình
3). Không giống như ung thư với gai tỏa ra từ trung tâm của u, sẹo hình sao
không có khối ở giữa mà có cấu trúc lệch tâm. Thỉnh thoảng có thể có mô mỡ
trong chỗ xuất phát tạo nên vùng sáng giúp ích cho chẩn đoán sẹo hình sao.
Trong hình ảnh mô học, đặc điểm đặc trưng là vùng sợi đàn hồi, bao quanh bởi những
ống méo mó dạng hình sao. Biểu hiện có thể thay đổi tùy thuộc vào sự xơ hóa,
tăng sinh biểu mô và sự méo mó của ống tuyến. Không giống như ung thư biểu mô
xâm lấn của ống tuyến vú, hình ảnh của sẹo hình sao có thể thay đổi rất nhiều tùy thuộc vào sự chiếu
hình của nhũ ảnh.
|
|
|
Hình 3.
Sẹo hình
sao ở phụ nữ 38 tuổi. A, Một khối bờ gai thấy trên hình ảnh phóng đại theo vị
trí craniocaudal. B, Hình ảnh siêu âm cho thấy một khối giảm âm với bóng lưng
mạnh phía sau. Có những hình ảnh tua gai xuất phát từ khối echo kém. Nghi ngờ
đây là một khối sẹo hình sao. Hình ảnh mô đại thể chủ yếu là sợi. C, Khối u
này phù hợp với vùng trung tâm hóa sợi (mũi tên) mà từ đó tỏa ra những đường
vành của những dải mô liên kết và những đơn vị tiểu thùy-ống tận, đặc trưng của
sẹo hình sao (phóng đại 25 lần). Vài ống tuyến nhỏ bị giãn dạng nang vì sự tắc
nghẽn tại chỗ do quá trình xơ hóa.
|
Trên hình ảnh siêu âm, có thể thấy một khối giảm âm với bóng lưng mạnh phía
sau. Không có đặc điểm siêu âm nào giúp phân biệt sẹo với tổn thương ác tính. Sự
kết hợp giữa siêu âm và nhũ ảnh có thể giúp chẩn đoán. Mặc dù những đặc điểm
hình ảnh có thể gợi ý chẩn đoán sẹo hình sao nhưng vẫn cần chỉ định sinh thiết
vì không thể chẩn đoán xác định chỉ bằng hình ảnh. Sinh thiết khối, chứ không
phải chọc hút tế bào bằng kim nhỏ, được đề nghị vì nguy cơ có những tổn thương
liên quan với tình trạng này như tăng sinh ống tuyến không điển hình, ung thư ống
tuyến vú tại chỗ, tân sinh tiểu thùy và ung thư tiểu thùy.
Bệnh Lý Tuyến Vú ở Người Tiểu Đường
Bệnh lý tuyến vú ở bệnh nhân tiểu đường được miêu tả lần đầu trong ngữ cảnh
của viêm giáp và bệnh khớp vào năm 1984 bởi Soler và Khardori. Đó là một tình
trạng ít gặp xuất hiện trên bệnh nhân tiểu đường lâu năm, mặc dù những đặc điểm
bệnh học tương tự cũng xuất hiện ở người không tiểu đường. Bệnh lý này thường
được chẩn đoán trên phụ nữ thời kì tiền mãn kinh. Bệnh nhân thường có khối ở vú
không xác định rõ, từ chắc đến cứng, giống như ung thư. Kích thước có thể thay
đổi từ vài milimet đến vài centimet.
Trên nhũ ảnh, thường không thấy được khối do mô tuyến vú rất dày. Vì vậy,
siêu âm là rất hữu ích trong mô tả tổn thương ở vú. Có thể thấy một khối có
bóng lưng sau trên siêu âm (Hình 4). Kết hợp bệnh sử và siêu âm có thể chẩn
đoán bệnh lý tuyến vú ở người tiểu đường nhưng giải phẫu bệnh được khuyến cáo để
chẩn đoán xác định.
|
|
|
Hình 4.
Bệnh lý
tuyến vú ở bệnh nhân tiểu đường 37 tuổi với bệnh sử 17 năm tiểu đường phụ thuộc
insulin. Khám lâm sàng sờ thấy một khối di động 3 cm ở ¼ trên trong ở vú
trái. Nhũ ảnh của bệnh nhân không cho thấy khối bất thường nào trên nền vú
dày.
A, Hình ảnh
một khối không rõ giới hạn với bóng lưng phía sau trên siêu âm. Kết quả giải
phẫu bệnh là bệnh lý tuyến vú ở bệnh nhân tiểu đường.
B, Phân
tích bệnh học cho thấy sự xơ hóa dạng sẹo, dày đặc và tình trạng viêm mạn
quanh tiểu thùy lan tỏa tạo bởi tế bào lympho nhỏ (phóng đại 100 lần).
|
Hoại Tử Mỡ
Hoại tử mỡ là tình trạng lành tính liên quan đến sau chấn thương hay phẫu
thuật. Tình trạng này thường không có triệu chứng nhưng bệnh nhân có thề sờ thấy
khối ở vú. Hình ảnh trên nhũ ảnh có thể thay đổi tùy thuộc một phần vào sự cách
xa thời gian giữa thời điểm chụp nhũ ảnh với sự kiện khởi phát. Một khối bờ gai
không đều có hoặc không có vôi hóa, khối vôi hóa, nang dầu hoặc không có bất
thường trên nhũ ảnh. Trên siêu âm, có thể thấy một khối giảm âm với bóng lưng
phía sau (Hình 5). Trong trường hợp của những nang dầu, giai đoạn trễ của quá
trình hoại tử mỡ, một khối giảm âm có giới hạn kèm theo hoặc không có bóng lưng
có thể được tìm thấy. Thường thấy được vòng có hồi âm mỏng dù có bóng lưng hay
không. Những đặc tính khác của siêu âm là cấu trúc echo hỗn hợp và khối mô mềm
trong nang. Mặc dù những đặc điểm này có thể gây hoang mang, nhưng những đặc điểm
trên nhũ ảnh là điển hình lành tính và gợi ý chẩn đoán.
|
|
|
Hình 5.
Hoại tử
mỡ ở một phụ nữ 43 tuổi có tiền sử mổ u vú gần đây và sự co rút vú phải. Bệnh
nhân có một khối sờ thây được ở vú phải. Nhũ ảnh không phát hiện bất thường.
A, Một vùng có bóng lưng phía sau trên siêu âm. Bệnh nhân được làm sinh thiết
và kết quả là hoại tử mỡ. B, Hình ảnh phóng đại của hoại tử mỡ cho thấy tình
trạng viêm mạn tính tạo bởi tế bào lympho và bọt bào và phản ứng đại bào
(phóng đại 100 lần).
|
|
|
|
Hình 6.
Hoại tử
mỡ trên bệnh nhân 24 tuổi có một khối sờ thấy được ở vú trái. Siêu âm tuyến
vú được thực hiện đầu tiên, cho thấy những khối giảm âm với bóng lưng phía
sau.
A, Hình ảnh một trong những khối trên siêu âm.
B, Nhũ
ãnh cho thấy vài khối vôi hóa viền, chắc chắn cho chẩn đoán hoại tử mỡ. Bệnh
nhân không có tiền sử chấn thương. Sự tương quan với những hình ảnh nhũ ảnh
có giới hạn trên phụ nữ trẻ này giúp chẩn đoán chính xác bệnh nguyên của những
bất thường tuyến vú sờ thấy được.
|
Hình ảnh mô học của hoại tử mỡ thay đổi theo thời gian của quá trình. Đặc
điểm tạo khối cấu tạo bởi sự viêm bạch cầu lympho, bọt bào và xơ hóa bù trừ.
Sẹo Mổ
Sau khi sinh thiết tổn thương vú lành tính, mô tuyến vú thường lành lại mà
không có sự thay đổi nào đáng kể. Bệnh nhân trải qua phẫu thuật bảo tồn cho ung
thư vú sẽ tăng khả năng có sự co kéo và tạo sẹo sau mổ và xạ trị. Những triệu
chứng này có thể gây lầm lẫn nếu bệnh sử không được khai thác đúng. Trong những
trường hợp tiền sử bệnh không chính xác, sẹo sau phẫu thuật có thể nhầm lẫn với
một tổn thương ác tính
Một mảng có bóng lưng sau có thể được thấy trên siêu âm. Theo kinh nghiệm của
chúng tôi thì bóng lưng của sẹo thường là bóng lưng không có khối trung tâm. Đặc
điểm này giúp phân biệt sẹo với ung thư, có bóng lưng từ khối trung tâm. Trên tổn
thương sẹo, mức độ của bóng lưng phía sau có thể nhiều hơn ở một mặt cắt nhất định
nào đó (Hình 7). Thỉnh thoảng, một mép của mặt cắt giảm âm có thể lan rộng từ
giường phẫu thuật đến mặt da.
|
|
|
Hình 7.
Sẹo mổ
trên một phụ nữ 57 tuổi với tiền sử mổ sinh thiết u lành vú trái. A và B, Vị
trí sẹo trên siêu âm cho thấy bóng lưng dày. Không tìm thấy khối trung tâm. Mức
độ của bóng lưng thấy rõ hơn trong mặt cắt antiradial (A) hơn trong mặt cắt
radial (B).
|
Xơ Hóa Khu Trú (Focal Fibrosis)
Xơ hóa khu trú là tình trạng tương đối thường gặp, 9% trường hợp tổn thương
qua chọc hút bằng kim nhỏ. Được mô tả đầu tiên bởi Haagensen khi ông ghi nhận sự
xuất hiện của tình trạng này trong tuổi sinh đẻ và liên quan đến hormon. Trên
thực tế quá trình này có thể có nhiều nguyên nhân, mà trong đó sự co rút một phần
hay co rút khu trú của tuyến vú có lẽ là thường gặp nhất.
Xơ hóa khu trú có đặc điểm đa dạng trên siêu âm và nhũ ảnh. Trên nhũ ảnh là
một khối có giới hạn, không đều, mật độ không đồng nhất, cấu trúc méo mó. Tương
tự, trên siêu âm có thể là khối có giới hạn hay không, giảm âm có hoặc không có
bóng lưng phía sau (Hình 8 và 9). Nghiên cứu bệnh học của tình trạng này chỉ
khác ở một khía cạnh: đặc tính của bề mặt tổn thương với mô vú xung quanh. ]Quá trình này chủ yếu được mô tả tạo thành một
khối sờ được trên lâm sàng có giới hạn vi mô không rõ, một số khác cho rằng khối
này là riêng biệt và có giới hạn rõ. Thực
tế thì hai đặc tính này tương đồng với hình ảnh. Theo định nghĩa, không có sự
xuất hiện của thành phần biểu mô trong thay đổi sợi bọc. Phân tích bệnh học là
chìa khóa, bao gồm sự xơ hóa mô đệm dày đặc cùng với sự teo lại của ống và tiểu
thùy. Có thể có sự thâm nhập của tình trạng viêm mạn tính tạo bởi tế bào
lympho.
|
|
|
Hình 8.
Xơ hóa
khu trú ở một phụ nữ 32 tuổi với một khối ở vú sờ thấy được. Nhũ ảnh cho thấy
mô tuyến vú dày không có bất thường. A, Siêu âm vùng sờ thấy u và một mảng giảm
âm có bóng lưng phía sau. Sinh thiết khối được chỉ định và kết quả là xơ hóa.
B, Phân tích bệnh học là một khối rời rạc không thấy được qua vi thể hay đại
thể, mô được tạo thành bởi mô xơ ít tế bào có sự co rút hoàn toàn của cấu
trúc mô tuyến vú (phóng đại 100 lần). Vài tế bào mỡ rõ ràng tại bờ của mô cũng
như trong những dải mỏng trung gian và những cái hốc nhỏ.
|
|
|
|
Hình 9.
Xơ hóa
khu trú ở phụ nữ 87 tuổi với một khối sờ thấy ở vú trái. A, Nhũ ảnh mặt cắt
craniocaudal cho thấy tăng đậm độ ở trung tâm vú, nhưng không thấy được ở
hình ảnh 2 năm trước (B). C, Hình ảnh vùng giảm âm có bóng lưng trên siêu âm.
Kết quả giải phẫu bệnh là xơ hóa. D, Phóng đại trung bình, hình ảnh vùng xơ
hóa dày đặc với nhiều đám collagen và tế bào trung mô bắt màu nhạt (phóng đại
100 lần). Có thâm nhiễm viêm mạn rải rác của tế bào lympho.
|
Xơ Chai Tuyến (Sclerosing
Adenosis)
Xơ chai tuyến là một thành phần của phức hợp thay đổi sợi bọc quá mức, thường
là rải rác nhưng cũng có thể tạo thành khối (còn gọi là u tuyến), có thể xuất
hiện trong trường hợp sẹo hình sao và u nhú xơ chai để tạo thành những hình ảnh
và bệnh học phức tạp. Tình trạng này tạo nên hình ảnh bất thường trên nhũ ảnh mặc
dù hiếm khi sờ thấy khối trên lâm sàng. Hình ảnh thường gặp nhất là một nhóm
vôi hóa lốm đốm hay không định hình hoặc vôi hóa li ti. Tuy nhiên xơ chai tuyến
có thể tạo nốt hoặc khối có gai. Dù hình ảnh siêu âm đánh giá còn giới hạn
nhưng có thể thấy bóng lưng phía sau, như trên Hình 10.
|
|
|
Hình 10.
Xơ chai
tuyến ở một phụ nữ 45 tuổi. A, Hình ảnh siêu âm là một vùng không rõ có bóng
lưng sau (mũi tên). Mức độ của bóng lưng không mạnh như của ung thư vú. B và
C, mẫu vi thể cho thấy một phức hợp của thay đổi sợi bọc chiếm ưu thế là xơ
chai tuyến và những sẹo hình sao trên vi thể tạo thành nốt và xơ hóa bắt màu
nhạt. (phóng đại 50 lần).
|
Mô Tuyến Vú Bình Thường
Siêu âm đánh giá mô tuyến vú bình thường có thể găp
bóng lưng phía sau khi người làm siêu âm lướt đầu dò trên những bề mặt như dây
chằng Cooper hay mô liên kết khác. Tuy nhiên khi đánh giá lại và thay đổi mặt cắt
sẽ không thấy bóng lưng hoặc bóng lưng mờ đi. Ngoài ra, vì bóng lưng sau được tạo
bởi bề mặt nên sẽ không tìm thấy khối. Ví dụ này cho thấy sự quan trọng của
siêu âm trong đánh giá những tổn thương vú khó quan sát. Hình 11 cho thấy bóng
lưng là xảo ảnh trên mô tuyến vú bình thường.
|
|
|
Hình 11.
A, Hình ảnh siêu âm tuyến vú bình thường có bóng lưng phía sau. B, Xem lại
ở cùng vị trí, không còn thấy bóng lưng.
|
Kết Luận
Siêu âm là công cụ không thể thiếu trong đánh giá bệnh
lý tuyến vú. Hình ảnh bóng lưng phía sau là một đặc tính thường găp trong ung
thư. Tuy nhiên cần nhớ rằng đặc điểm này có thể thấy trong những tổn thương
lành tính. Bệnh sử kết hợp với nhũ ảnh và siêu âm sẽ đưa đến chẩn đoán chính
xác. Nếu cần thực hiện chọc hút tế bào bằng kim nhỏ trong trường hợp những tổn
thương có bóng lưng phía sau, cần lưu ý rằng những chẩn đoán lành tính như u sợi
tuyến hay bệnh lý tuyến vú ở người tiểu đường có thể đạt được chính xác bằng chẩn
đoán hình ảnh.


