Tổng số lượt xem trang

Thứ Sáu, 15 tháng 6, 2018

Stress echo beats CCTA for evaluating chest pain


By Kate Madden Yee, AuntMinnie.com staff writer
June 13, 2018 -- Stress echocardiography is a safe method of evaluating chest pain in patients who present to the emergency department, resulting in lower rates of hospitalization and shorter hospital stays when compared with coronary CT angiography (CCTA), according to a study published online June 13 in JACC: Cardiovascular Imaging.
The findings suggest that stress echo could be an effective alternative to CCTA for emergency department (ED) chest pain triage, reducing patients' radiation exposure and healthcare costs. But the modality is often disregarded as an option, wrote a team led by Dr. Jeffrey Levsky, PhD, from Albert Einstein College of Medicine in New York City.
"[Concerns] regarding CCTA use include radiation exposure, increased subsequent noninvasive testing ... increased catheterization and coronary revascularization of uncertain benefit, increased downstream clinical resource utilization, and the burden inherent to incidental findings," the group wrote. "Each of these concerns is addressed by the alternative use of stress echocardiography, a modality that has been assessed in early emergency department triage but is often overlooked."
Better assessment?
Cardiovascular disease causes one of three deaths worldwide, Levsky and colleagues wrote. Chest pain is a common reason patients present in the emergency department due to concerns that the pain signifies a heart attack. There are a number of ways to assess chest pain, but CCTA is quick and has been shown to reduce a patient's stay in the hospital compared to other modalities such as nuclear myocardial perfusion imaging (MPI)
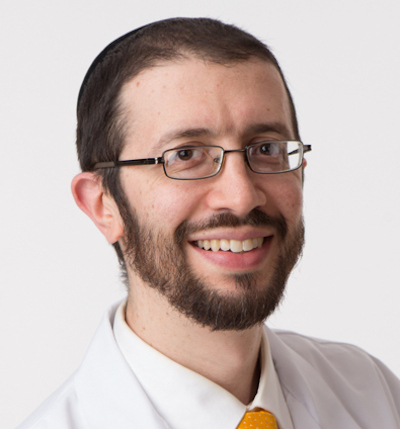
Dr. Jeffrey Levsky, PhD
Dr. Jeffrey Levsky, PhD, from Albert Einstein College of Medicine.
"We conducted this study because there are very few published trials that rigorously compare different ways to work up emergency department chest pain patients," Levsky told AuntMinnie.com. "Chest pain is such an important emergency presentation -- involving literally millions of Americans yearly -- but assessing it can take a lot of time and expense."
CCTA exposes patients to radiation, however, and it can prompt further procedures that may or may not be of benefit, the group noted. That's why stress echocardiography shows promise for evaluating chest pain in the emergency department, although it does have its challenges.
"Stress echo requires close coordination of the exercise and imaging parts and a good deal of patient cooperation," he said. "Critics of the technique feel it is too low in sensitivity. But on the other hand, it does not require radiation, and long-term outcomes are good when the test is negative."
Levsky and colleagues started with 400 low- to intermediate-risk acute chest pain patients who presented to the emergency department between August 2011 and January 2016 and randomized them to CCTA (201 patients) or stress echocardiography (199 patients). The patients had no known coronary artery disease and had negative initial serum troponin levels. The study's primary outcome measure was the hospitalization rate, while its secondary end point was the length of stay in the emergency department and/or the hospital. Of the subjects, 42.5% were women and 87.3% were ethnic minorities, the group wrote.
The researchers found that patients who underwent stress echocardiography had lower rates of hospitalization, shorter emergency department and hospital stays, and fewer adverse events on follow-up (although this last metric was not statistically significant).
Comparison of CCTA vs. stress echo for chest pain
MeasureCCTAStress echocardiographyChangep-value
Hospitalized on arrival at ED19%11%-8 percentage point change0.026
Median ED stay5.4 hours4.7 hours-13%< 0.001
Median hospital stay58 hours34 hours-41%0.002
Adverse events over a median 24 months of follow-up117-36%0.47
Median initial workup radiation exposure6.5 mSvNone-100%N/A
"[Our study] provides the first comparison of CCTA and stress echocardiography in emergency department chest pain patients and shows a statistically significant 8% reduction of hospitalization in patients triaged with stress echocardiography compared to CCTA," the group wrote.
The researchers also found an overall trend toward less resource utilization over a 24-month follow-up period among patients who underwent stress echocardiography, although most measures did not reach statistical significance. There was no statistically significant difference between CCTA and stress echocardiography regarding subsequent catheterization and revascularization, and patients rated their experience with stress echocardiography more favorably than with CCTA.
An effective tool
Stress echocardiography appears to be a safe and effective tool for evaluating chest pain in the emergency department compared with CCTA, Levsky and colleagues wrote.
"Stress echocardiography resulted in the discharge of a significantly higher number of patients with significantly shorter lengths of stay, was safe at intermediate-term follow-up, and provided a better patient experience," they concluded.

Letters blast study linking ultrasound and autism


By Kate Madden Yee, AuntMinnie.com staff writer
June 11, 2018 -- A study published in February in JAMA Pediatrics that suggested a link between the incidence of autism spectrum disorder (ASD) and prenatal ultrasound is coming under fire by critics who are calling out the study's conclusion as oversimplified at best and inaccurate at worst

The original research, conducted by a team led by Dr. N. Paul Rosman of Boston Medical Center, claimed to find a statistically significant association between the development of ASD and one technical sonography parameter: the depth of ultrasound penetration for scans performed at certain points during pregnancy.
But this measure isn't valid, wrote Dr. Christoph Lees from the Imperial College Healthcare NHS Trust in London in a letter published online June 11, also in JAMA Pediatrics.
"The authors introduce a hitherto unheard-of index: the depth of ultrasonographic penetration," he wrote. "This has no clear biological or scientific justification. Nevertheless, they report that the mean depth of penetration of the ultrasound beam is greater in those who developed ASD than in healthy children. But depth of penetration of ultrasound is not a measure of ultrasonography exposure; it simply tells us how far the ultrasound beam reaches."
The study authors' conclusion that "further research is needed to determine whether other variables of ultrasound exposure also have adverse effects on the developing fetus" doesn't accurately reflect the data, he wrote.
"In apparent contravention of JAMA Pediatrics' guidance for reporting clinical studies of this nature, no recruitment flowchart with participant exclusion/inclusion criteria is shown, and neither a priori hypothesis, predefined primary outcome, nor sample size calculation are included," Lees wrote.
The study also drew criticism in a letter from Drs. David Somerset and Robert Wilson of the University of Calgary, who believe the study's conclusion that "greater ultrasonographic depth" negatively affects the fetus has not been proved and is a "gross oversimplification."
"The authors present no evidence that a mean difference of 4 mm in depth is associated with higher energy delivery to the fetus," they wrote. "Furthermore, clinical variables, such as maternal obesity and age and paternal age, are independently associated with ASD ... and these variables have not been accounted for. It is a shame that ... [the] study has such an alarmist conclusion in the abstract that is not supported by the study findings."
Because possible links between ultrasound and autism cause such anxiety among parents and pregnant women, it's crucial that studies are reported accurately, Lees concluded.
"In fact, this study shows that children with ASD were exposed to a shorter duration of prenatal ultrasonography and lower-energy scans than healthy children," he wrote. "These findings are reassuring. We respectfully suggest that a more accurate form of words would have reflected the study's finding than is found in the conclusion of the abstract.

Thứ Tư, 6 tháng 6, 2018

POCUS helps medical students find more AAAs than surgeons


By Kate Madden Yee, AuntMinnie.com staff writer
June 1, 2018 -- With a bit of training, medical students using point-of-care ultrasound (POCUS) can identify more abdominal aortic aneurysms (AAAs) than vascular surgeons can by screening for the condition via physical exam, according to a study published online May 17 in the Annals of Vascular Surgery.
The findings not only confirm ultrasound's efficacy for this application but also suggest a new resource for AAA screening in an era when medical staff can be stretched thin, wrote the team led by Trinh Mai from the University of Ottawa.
"Screening for AAA has been found to be largely underutilized in the U.S., with only 15% of eligible and at-risk individuals receiving screening examinations," the researchers wrote. "To mitigate obstacles associated with access to screening [such as staff and device availability] ... the introduction of point-of-care ultrasound training at the medical student level, and its wide-scale implementation as an extension to physical examination, may lead to improved detection of AAA."
Ultrasound training
When untreated, abdominal aortic aneurysms have a mortality rate as high as 85% to 90%, Mai and colleagues wrote. Physical examination has low sensitivity and specificity, even when experienced physicians perform it.
Ultrasound is much more effective and is currently the primary imaging tool used to screen for the condition, but its widespread use for this application has been hindered by cost and the availability of appropriately trained technicians.
However, there's mounting evidence that medical personnel with no previous training can effectively use ultrasound to screen for AAA, especially with point-of-care ultrasound.
"The objective of our study was to determine whether a medical student, after a short training period, could reliably screen for abdominal aortic aneurysms," the group wrote. "We compared the test characteristics of point-of-care ultrasound performed by a medical student versus physical examination by vascular surgeons and a gold standard reference scan."
For the study, the researchers included data from 57 patients who presented to an outpatient vascular surgery clinic between October 2015 and March 2016 to be screened for abdominal aortic aneurysm. A vascular surgeon evaluated each patient via physical exam, followed by a second-year medical student using POCUS; patients then underwent a reference CT or vascular sonographer-performed ultrasound exam within three months of this initial screening visit.
The student had three hours of training with POCUS for detecting and measuring AAA. The training included a theoretical component led by a vascular sonographer and a practical component taught by an emergency physician, during which the student practiced ultrasound scanning under direct guidance.
After this initial training, the student practiced using ultrasound on the abdominal aortas of 60 patients with and without the condition. The student then completed a competency assessment before beginning to scan study participants, Mai and colleagues wrote.
Most of the patients (61%) were men, and the median patient age was 71. Reference exams identified 16 abdominal aortic aneurysms with a mean maximum aortic diameter of 29.5 mm. Of these, the vascular surgeon identified 11, with two false positives, for a sensitivity rate of 66.7% and a specificity rate of 94.4%. The average time to conduct the physical exam was 35 seconds.
Medical students using point-of-care ultrasound found 15 of the 16 abdominal aortic aneurysms with a mean maximum aortic diameter of 28 mm, for a sensitivity rate of 93.3% and a specificity rate of 100%. The average time to conduct the ultrasound exam was four minutes, the group wrote.
Physical exam vs. POCUS for AAA screening
MeasurePhysical examPoint-of-care ultrasound
Sensitivity68.8%93.8%
Specificity93.9%100%
Positive predictive value81.8%100%
All results were statistically significant.
"The results of our study, as well as several others, have proven that physical examination is relatively unreliable for the detection of abdominal aortic aneurysms," the researchers noted. "Screening for abdominal aortic aneurysms may be accurately and efficiently performed by a novice operator using point-of-care ultrasound with relatively limited training and experience."
Core curriculum?
Because point-of-care ultrasound appears to be an effective tool for identifying AAA, perhaps its use should be more formally incorporated into the medical school curriculum, Mai's team suggested.
"This study raises the question of whether we should be changing the way we are teaching medical students," the group wrote. "With the increased prevalence and use of ultrasound in medical practice, perhaps we should consider teaching focused ultrasound for abdominal aortic aneurysm detection as a standard in the medical school curriculum."

Thứ Năm, 31 tháng 5, 2018

Cesarean delivery changes the uterine angle


By Kate Madden Yee, AuntMinnie.com staff writer
May 30, 2018 -- Cesarean delivery can change the angle of a woman's uterus from an anteflexed one, in which the fundus faces the abdominal wall, to a retroflexed one, in which it faces the sacrum, according to a study in the May issue of the Journal of Ultrasound in Medicine


Because a retroflexed uterus can increase a woman's risk of uterine perforation during gynecologic surgery or the placement of an intrauterine device (IUD), the angle of her uterus after cesarean must be determined via ultrasound, wrote a team led by Dr. Andrea Agten of St. George's University Hospitals in London.
"Over the years, reports have associated a retroflexed uterine position with an increased surgical complication rate (e.g., uterine perforation) ... [and] although in many cases perforations are innocuous, some lead to infections, hemorrhage, and trauma to other abdominal organs," Agten and colleagues noted. "Therefore, all women with a history of cesarean delivery should undergo a transvaginal ultrasound examination before any gynecologic surgery or IUD placement" (J Ultrasound Med, May 2018, Vol. 37:5, pp. 1179-1183)
Which angle?
One of the ways the position of the uterus is assessed is by its flexion angle, which is the measure between the uterus and the cervix. Gauging uterine position is crucial for successful gynecologic procedures such as dilation and curettage, endometrial biopsy, and IUD insertion, the team wrote.
The researchers conducted the study because they had observed an increase in retroflexed uteri in their practice. And because the number of cesarean deliveries has also increased, they sought to investigate whether this higher incidence of retroflexed uterus could be caused by cesarean delivery.
The study included data from 173 patients who had undergone transvaginal ultrasound before and after either vaginal or cesarean delivery between 2012 and 2015, excluding women who had undergone a previous cesarean delivery. Two radiologist readers measured flexion angles from these exams before and after the women gave birth, and they compared them between women with vaginal and cesarean deliveries.
Of the 173 women, 107 had vaginal deliveries (62%) and 66 had cesareans (38%). The mean interval between scans was 18 months; interreader agreement for flexion angles was almost perfect, the researchers found (0.939 before delivery and 0.969 after, p < 0.001).
There was no significant difference in mean flexion angles between the uterus and the cervix for either type of delivery on antepartum ultrasound (145.8° for vaginal delivery and 154.8° for cesarean). But mean postpartum flexion angles increased significantly after cesarean, at 152.8° for women who had a vaginal delivery compared with 180.4° for those who underwent a cesarean (p < 0.001).
The change in flexion angle translated into a shift from anteflexed to retroflexed in more of the women who underwent cesarean delivery than those who had a vaginal delivery (29% versus 13%, p = 0.003).
"Our study showed that cesarean delivery can change the natural position of the uterus ... [and that it was] associated with the new development of a retroflexed uterus in one-third of our patients," Agten's group wrote.
Avoiding complications
Because a retroflexed uterine position has been associated with surgical complications, it's important for a woman's health going forward to assess the position of her uterus after she has had a cesarean, Agten and colleagues wrote.
"Cesarean delivery can change the uterine flexion angle to a more retroflexed position," the researchers concluded. "Therefore, all women with a history of cesarean delivery should undergo a transvaginal sonography examination before any gynecologic surgery or IUD placement to reduce the possibility of surgical complications.

Thứ Tư, 30 tháng 5, 2018

Can AI reliably measure carotid intima-media thickness?


By Erik L. Ridley, AuntMinnie staff writer
May 25, 2018 -- Artificial intelligence (AI) software that combines deep-learning and machine-learning techniques can measure carotid intima-media thickness (CIMT) more accurately than sonographers can, according to research in the July 1 issue of Computers in Biology and Medicine.

In testing, a multi-institutional and multinational team led by Mainak Biswas of the National Institute of Technology Goa in India found that its deep learning-based model outperformed previous automated methods. The model was also up to 20% more accurate than sonographers in measuring CIMT, an important biomarker for cardiovascular disease and stroke monitoring.
"The results showed that the performance of the [deep learning]-based approach was superior to the nonintelligence-based conventional methods that use spatial intensities alone," the authors wrote. "The [deep-learning] system can be used for stroke risk assessment during routine or clinical trial modes."
An important biomarker
An increase in CIMT -- the mean perpendicular distance between the lumen-intima (LI) and the media-adventitia (MA) interfaces -- has been associated with an increased risk of cardiovascular events and stroke. However, the current process of measuring CIMT suffers from accuracy and reproducibility issues due to factors such as variability in patient nationality, ethnicity, disease, and age group. Technical challenges also play a role; traditional manual segmentation of these regions is slow, error-prone, and subject to intraobserver and interobserver variability, according to the researchers (Comput Biol Med, July 1, 2018, Vol. 98, pp. 100-117).
As a result, a number of automated techniques have been developed for predicting CIMT, using various spatial features such as grayscale median, pixel classification, gradient edges, space-scale, or a combination of these features, the researchers explained.
"Despite their strong contributions, these external factors make the spatial-based methods prone to variability and a lack of robustness when it comes to completely automated designs," they wrote.
Biswas and colleagues hypothesized that a deep-learning system would be more reliable and accurate than previous methods, thanks to its inherent ability to provide better regional segmentation output. To train and test a deep-learning model, the researchers used 396 high-resolution B-mode ultrasound images of the right and left common carotid artery from 203 patients at Toho University in Japan. The ultrasound scans were obtained on one of three ultrasound systems (Aplio XV, Aplio XG, and Xario) from Canon Medical Systems. Of the 396 images, 90% were used for training the deep-learning model and 10% were set aside for testing.
Manual tracing of the lumen and adventitia borders was performed using ImgTracer software (AtheroPoint). Dr. Jasjit Suri, PhD, from AtheroPoint served as senior author on the study.
A 2-stage system
The researchers developed a two-stage system that made use of both deep and machine learning. In the first stage, a convolution layer-based encoder was used to extract image features, while a decoder based on a fully convolutional neural network (CNN) performed image segmentation. The raw inner lumen borders and raw outer interadventitial borders generated during this process were then smoothed with a machine learning-based method. The model utilized these final borders to calculate CIMT values from the LI and MA far walls using the standardized polyline distance metric method.
As two different sets of gold standards -- lumen regional information and interadventitial regional information -- were used during the design of the deep-learning model, the researchers trained and evaluated two different algorithms. Compared with the gold standard, the two deep-learning algorithms yielded CIMT error rates of 0.126 ± 0.134 mm and 0.124 ± 1.0 mm. They also significantly outperformed previously developed systems for measuring CIMT, according to the researchers.
Biswas and colleagues also compared the performance of the deep-learning algorithms with mean far-wall CIMT measurements calculated by sonographers in 346 images. Both models correlated better with the ground truth than the sonographer measurements, which had been performed in real-time in the institution's vascular ultrasound laboratory.

Coefficient of correlation with ground truth
 Manual sonographer measurement of CIMTDeep-learning methodImprovement of deep-learning method over sonographer measurement
Ground truth 10.80Model 1: 0.9620%
Ground truth 20.83Model 2: 0.9514.5%
The deep-learning method takes only a few milliseconds to perform, according to the researchers. They acknowledged, though, that the system relied on a dataset limited to a Japanese diabetic cohort, and it has not been tested on a wide variety of datasets.
As a result, it needs to be evaluated further in a multiethnic patient population with subclinical atherosclerosis and low-, moderate-, and high-risk scenarios, they wrote. The approach must also be evaluated on ultrasound images from different equipment vendors, and it should also be extended from a desktop PC-based application to a web-based version, according to the group.

Thứ Sáu, 25 tháng 5, 2018

KIDNEY STONE AND ULTRASOUND

By Kate Madden Yee, AuntMinnie.com staff writer
May 24, 2018 -- Which modality works best for diagnosing kidney stone disease, also known as urolithiasis: digital tomosynthesis, ultrasound, or the current reference standard of multidetector CT (MDCT)? It depends, according to a study published online May 17 in the European Journal of Radiology.
Many imaging modalities can be used to diagnose the disease, wrote a team led by Dr. Manavjit Singh Sandhu of the Postgraduate Institute of Medical Education and Research (PGIMER) in Chandigarh, India. But it can be challenging to determine which one is best in a given clinical situation.
"With numerous technological advancements in the field of radiology, many imaging modalities can be employed for the diagnosis of urolithiasis and it becomes confusing and at times difficult to decide which one to choose and when," Sandhu and colleagues wrote. "Clinicians [must] be aware of the potential benefits and relative strength of each imaging modality [to balance its use with] healthcare costs, radiation burden, and contrast patient safety in a given clinical scenario."
Imaging is key
Urolithiasis affects a wide range of patients, and imaging is a key part of both diagnosing the condition and following patients after diagnosis, according to the group. MDCT is the current gold standard for detecting the disease, with a sensitivity of 97% and a specificity of 98%. But it also has the highest radiation dose among the modalities used for this purpose.
"CT cannot be used too frequently in patients with recurrent calculi, or in post-treatment patients on follow-up," Sandhu and colleagues noted.
As an alternative to MDCT, digital tomosynthesis overcomes limitations found in conventional tomography, imparting minimal radiation dose and removing overlying structures that can confuse diagnosis. And ultrasound offers benefits such as convenience, low cost, and lack of radiation. So which of these two modalities should clinicians use to diagnose kidney stone disease, and when?
Sandhu and colleagues compared the diagnostic performance of digital tomosynthesis with that of ultrasound, using MDCT as the reference standard. The study included 66 patients who were either suspected of having kidney stone disease or had a history of recurrent disease; of these, 41 had urolithiasis and 25 had nonrenal causes of abdominal pain.
All patients underwent digital tomosynthesis, ultrasound, and MDCT within a 24-hour period. Two radiologists categorized the calculi, or stones, according to location and size. Sandhu's group then examined the sensitivity, specificity, and positive and negative predictive values for tomosynthesis and ultrasound.
In the 41 patients with urolithiasis, MDCT found 121 stones (105 renal, 14 ureteric, and two vesical), most of which were smaller than 5 mm.
No. of calculi found with MDCT, digital tomosynthesis, and ultrasound
CategoryMDCTDigital tomosynthesisUltrasound
Reader 1Reader 2Reader 1Reader 2
Location
Kidney10551475651
Ureter14111065
Urinary bladder22222
Size
< 5 mm529797
5-10 mm3228252219
> 10 mm3727263332
The average overall sensitivity of digital tomosynthesis for identifying kidney stone disease was 50% (p < 0.001), while the sensitivity of ultrasound was 50.4% (p = 0.005). As for identifying renal stones, digital tomosynthesis had a sensitivity of 47.1% and ultrasound a sensitivity of 50.9%; for ureteric stones, sensitivity was 74.9% with digital tomosynthesis and 39.2% with ultrasound.
"The disappointingly low sensitivity [of digital tomosynthesis] may be attributed to the fact that [most] of the calculi in our study group were smaller than 5 mm ... [which decreases] the overall sensitivity for digital tomosynthesis," the authors noted.
Digital tomosynthesis vs. ultrasound for kidney stone disease
Performance measureDigital tomosynthesisUltrasound
Sensitivity50%50.4%
Specificity89.8%89.8%
Positive predictive value96%96%
Negative predictive value26.5%26.5%
p-value< 0.001< 0.005

Although the results did not show a statistically significant difference between digital tomosynthesis and ultrasound for diagnosing urolithiasis, the researchers did find that digital tomosynthesis performed better than ultrasound when it came to ureteric stones, suggesting that the modality may be preferred for the initial evaluation of these patients.
"Among the 14 ureteric calculi, the majority were in the mid ureter, which is technically the most difficult part of the ureter to examine on ultrasound as it is generally obscured by overlying bowel gas shadows," the group wrote. "The diagnostic accuracy of digital tomosynthesis in detecting ureteric calculi was relatively improved as it removes the overlying structures [and] enhances local tissue separation ... which allows for better visualization of calculi in the ureter."
Ultrasound, however, is effective in identifying hydroureteronephrosis, a condition in which the kidney and ureter swell because of obstructed urine flow. Because hydroureteronephrosis needs to be ruled out for a urolithiasis diagnosis, the researchers concluded that both modalities have a place in the radiology toolkit for diagnosing kidney stone disease.
"In this study, we found no statistically significant difference between the performance of ultrasound and digital tomosynthesis in diagnosis of urolithiasis," the authors concluded. "Digital tomosynthesis performed significantly better than ultrasound in detecting ureteric calculi ... and therefore may be preferred in this subset of patients ... [but] in clinical practice, ultrasound still would remain the preferred modality in the initial workup of patients, especially those presenting acutely."

Thứ Ba, 22 tháng 5, 2018

SHEAR WAVE DISPERSION IMAGING for Liver Viscosity

TẠO HÌNH  ĐÀN HỒI PHÂN TÁN SÓNG BIẾN DẠNG [SHEAR WAVE DISPERSION IMAGING] CHO ĐỘ NHỚT GAN [LIVER VISCOSITY], Katsutoshi Sugimoto,  Canon Visions Magazine 30, pp 38-41, 2018.


Độ nhớt  khi dùng để đánh giá tích mỡ gan [fat deposition] và những thay đổi viêm hoại tử [necroinfammatory change] hiệu quả hơn độ đàn hồi mô.

Trong thực nghiệm trên chuột, dựa vào histopathology, với mô hình viêm, viscosity nhiều hơn elasticity;


 còn trong mô hình fibrosis, elasticity nhiều hơn viscosity.


Như đã biết, kỹ thuật đo đàn hồi mô SWE giúp đo định lượng và  biểu diễn độ đàn hồi mô trong thời gian thực. Y văn cho thấy SWE là kỹ thuật đánh gía hóa xơ [fibrosis] gan nhanh và hiệu quả, nhưng còn có giới hạn ở trường hợp gan viêm hay thấm mỡ.

Lý do SWE còn bị giới hạn là vì đặc tính nhớt đã cản trở thuật tóan định tính đàn hồi gan. Thật ra, mô gan có đặc tính đàn hồi nhớt và việc truyền sóng biến dạng tùy thuộc vào cả độ đàn hồi và độ nhớt. 
Đã được báo cáo rằng viêm gan cấp, gan thấm mỡ không do rượu (NAFLD) và viêm gan mỡ không do rượu (NASH) đều làm tăng độ nhớt gan, làm ảnh hưởng việc đánh giá độ cứng gan. 
Thêm nữa định lượng chính xác gan cứng cùng gan thấm mỡ và gan viêm còn là thách thức. Phát  hiện và điều trị sớm viêm gan cấp và tần suất cao của gan thấm mỡ cho phép đảo ngược tiến trình thoái hóa này. Do vậy cần sớm tiêu chí hóa phát hiện độ nhớt gan vào trong chẩn đoán.

Shear Wave Dispersion Imaging [SWD], tạo hình đàn hồi phân tán sóng biến dạng là kỹ thuật mới của dòng máy Aplio-i-series để đánh giá sự phân tán sóng biến dạng có liên quan đến đặc tính nhớt trong bệnh lý gan lan tỏa. Một bản đồ phân tán giúp quan sát được dispersion slope [khoảng dốc phân tán], là thông số trực tiếp của độ nhớt. Giá trị khoảng dốc phân tán với đơn vị (m/s/kHz) và độ lệch chuẩn được hiển thị. 

Ở SWE quad view mode (Fig.1), tốc độ sóng biến dạng hay tốc độ đàn hồi (Speed Map, Elascity Map), shear wave arrival time contour (Propagation Map), thang xám, và bản đồ phân tán (Dispersion Map) được hiển thị cùng lúc.


Nguyên lý của Shear Wave Dispersion Imaging


Gan có đàn hồi nhớt và tốc độ sóng biến dạng tùy thuộc vào cả độ đàn hồi và độ nhớt. Ở  vật liệu đàn hồi nhớt mô phỏng, độ nhớt (PA-s) như là ống nhún [damper, van giảm chấn động xoắn] và độ đàn hồi như một lò xo nhún [spring]. Độ nhớt  đo  sự chống lại với chuyển động nhấp tỉa tương đối, như cái ống nhún, mô chuyển động dưới biến dạng dần dần hơn là  biến dạng đột ngột. Độ đàn hồi đo được  khả năng mô chống lại biến dạng và trở lại trạng thái cũ. Như chuỗi lò xo co lại dưới áp lực và bung ra khi mất đè ép. Có 2 mẫu đàn hồi nhớt : model Maxwell, là một spring và một damper nối nhau trong một chuỗi; và model Voigt là một string và một damper nối song song.

Giống như SWE, để đánh giá độ nhớt, SWD đo sóng biến dạng lan truyền tạo ra trong mô bị biến dạng do một xung đẩy. Trong thuật toán định lượng SWE (kPa) hiện tại, đặc tính nhớt bị bỏ qua. Trong một ví dụ đo độ đàn hồi với model Voigt, mô gan được đánh giá đàn hồi hoàn toàn, bởi độ đàn hồi biến dạng được tính khi bỏ qua độ nhớt. Do liên hệ với độ đàn hồi biến dạng Young’s modulus E, độ đàn hồi E (kPa) có thể đo được từ tốc độ lan truyền sóng biến dạng (Fig 3).

Thật ra, mô gan có đặc tính đàn hồi nhớt. Bệnh mạn tính như viêm gan hay viêm gan mỡ được xem như làm tăng độ nhớt gan. Trong mô đàn hồi nhớt, tốc độ sóng biến dạng trải qua sự phân tán tần số [frequency dispersion], từ đó làm giảm tốc độ sóng biến dạng, cs tùy thuộc vào tần số sóng biến dạng của nó, f. Tương quan giữa tốc độ sóng biến dạng và tần số biến dạng quan sát được trong model Voigt, có nghĩa là  tốc độ sóng biến dạng được đánh dấu ngược lại tần số của nó với độ đàn hồi biến dạng khác và độ nhớt biến dạng (Fig 4). Trong mô đàn hồi hoàn toàn, tốc độ sóng biến dạng không đổi đối với tần số sóng biến dạng. Tuy nhiên, trong mô đàn hồi nhớt, tốc độ sóng biến dạng lại rất phụ thuộc vào tần số. Ở một độ đàn hồi cố định, với độ nhớt biến dạng gia tăng, khoảng dốc sẽ tăng, như vậy khoảng dốc cho thấy mức độ (degree) của tần số phân tán (Fig 5). Phân tán và độ nhớt có tương quan dương tính. 

SWD là kỹ thuật mới để thấy sự phân tán (slope). Chú ý SWD không đo độ nhớt trực tiếp,nhưng có lợi thế định lượng được sự phân tán, vốn là thông số liên quan trực tiếp đến độ nhớt.


Bản đồ Phân tán sóng biến dạng  [Shear Wave  Dispersion Map] cho thấy khoảng dốc phân tán, giúp đánh giá độ nhớt của gan. Giống như SWE, một xung đẩy làm mô gan biến dạng tạo nên sóng biến dạng. Dời chỗ mỗi điểm data (A hoặc B trong Fig 6) được phát hiện, thông tin thời gian và biên độ dời chỗ  được thu thập. Bằng cách sử dụng thuật toán FFT, tín hiệu sóng biến dạng được chuyển đổi thành phức hợp tần số sóng biến dạng.
Tần số sóng biến dạng có được tạo thành trục x cho việc tính khoảng dốc phân tán. Tốc độ sóng biến dạng được tính cho mỗi tần số dựa trên dời chỗ tương đối giữa các điểm data.
Tốc độ sóng biến dạng tính ở mỗi tần số được đánh dấu trên trục y. Độ dốc của tốc độ sóng biến dạng có được là trị giá của độ phân  tán tính bằng đơn vị m/s/kHz, diễn tả tốc độ sóng biến dạng đối với tần số sóng biến dạng. Trị giá độ phân tán chồng lên hình B-mode và tạo nên bản đồ phân tán. Đặt vùng ROI lên bản đồ phân tán sóng biến dạng sẽ tính được khoảng dốc phân tán và đánh giá được độ nhớt gan.

ĐÁNH GIÁ  LÂM SÀNG, pp 40-41, visions-magazine-issue-30

Kết luận 

Kết quả thực nghiệm lâm sàng với SWD, độ đàn hồi elasticity là thông số hiệu quả cho đánh giá hoá xơ gan, trong khi ở thấm mỡ gan và tình trạng viêm gan hoại tử là thông số độ nhớt viscosity.

SWD, tạo hình đàn hồi phân tán sóng biến dạng, là kỹ thuật tạo hình mới giúp đánh giá độ nhớt có tiềm năng cho lâm sàng bệnh lý gan.