Tổng số lượt xem trang

Thứ Bảy, 2 tháng 6, 2012

Demons-Meigs syndrome


Demons-Meigs syndrome - also known as or related to Meigs' syndrome (disorder), Meigs' syndrome, Meig's syndrome, Meigs syndrome, Meigs-Cass syndrome, ovarian-ascites-pleural effusion syndrome


Alternative eponyms


  • Demons-Meigs syndrome
  • Meigs-Cass syndrome
Related people


  • John W. Cass
  • Albert Jean Octave Demons
  • Joe Vincent Meigs

A syndrome characterised by a solid ovarian tumour, usually a fibroma, accompanied by ascites and pleural effusion.

Description


A syndrome characterised by a solid ovarian tumour, usually a fibroma, accompanied by ascites and hydrothorax. Occurs mainly in elderly women. Pseudo-Meigs' syndrome (a term given by Meigs) is the same as true Meigs' syndrome, except that in the pseudo-Meig’s syndrome the tumor may be in the ovary, tubes, uterus or round ligament.


The first report of this condition involved Dame Mary Page, wife of Sir Gregory Page, Bunhill Fields, England, who died in 1728, in her 56th year. Otto Spiegelberg (1830-1881) in 1866 first described a patient with fibroma, ascites, and hydrothorax, and erroneously concluded that the diagnosis was “ovarian pregnancy.” Next description in 1879 by Charles James Cillingworth (1841-1908). Further descriptions 1887 by Albert Jean Octave Demons (1842-1920) of France, 1892 by Robert Lawson Tait (1845-1899) of England. P. Pascale and Louis Félix Terrier (1837-1908) in 1888 also described incomplete forms of Meigs syndrome. Meigs described the condition in 1934 and, with John W. Cass, in 1937 described it as a syndrome comprising ovarial fibroma, ascites and hydrothorax. Their first report comprised a detailed casuistic of seven cases collected during the years 1901-1934, as well as a principal discussion of the syndrome. The same year, in 1937, J. E. Rhoads and A. W. Terrell described another case, and these authors termed the condition Meigs' syndrome. [Source:  Whonamedit?A dictionary of medical eponyms, available at http:\\ www.whonamedit.com/synd.cfm/2351.html]


But what did Salmon?


In 1934, Salmon UJ described the association of pleural effusion with benign pelvic tumors (Source :Meigs Syndrome,  Klaus-Dieter Lessnau, emedicine.medscape.com/article/255450-overview).


Như vậy Meigs syndrome còn được gọi là Meigs-Salmon syndrome theo các tác giả anglosaxon, hay Demons-Meigs syndrome theo các tác giả Pháp.


_______________________________ 

Meigs Syndrome
Author: Klaus-Dieter Lessnau, MD, FCCP; Chief Editor: Warner K Huh, MD

Updated: Jul 15, 2011

Source :Meigs Syndrome, Klaus-Dieter Lessnau, emedicine.medscape.com/article/255450-overview
What would you like to print?
    Hội chứng Meigs được định nghĩa như tam chứng gồm u buồng trứng lành tính, báng bụng và tràn dịch màng phổi đều được giải quyết sau khi cắt bỏ khối u. U buồng trứng trong hội chứng Meigs là một u sợi [fibroma].


    Năm 1934, Salmon đã kết hợp tràn dịch màng phổi với các u lành tính vùng chậu. . [1] Năm 1937, Meigs và Cass mô tả 7 trường hợp u sợi buồng trứng có liên quan với báng bụng và tràn dịch màng phổi. Năm 1954, Meigs đề nghị hội chứng Meigs thật sự  bằng cách giới hạn u buồng trứng đặc lành tính kèm theo báng bụng và tràn dịch màng phổi, với điều kiện loại bỏ khối u sẽ chữa lành mà không tái phát. thecoma, cystadenoma, or granulosa cell tumor. Về mô học, u buồng trứng lành tính có thể là một u sợi [fibroma], u vỏ bao [thecoma], u tuyến dạng nang [cystadenoma], hoặc u tế bào hạt [granulosa cell tumor].
    Pseudo-Meigs syndrome bao gồm tràn dịch màng phổi, báng bụng, và các u lành tính của buồng trứng khác hơn fibromas.. Những u lành tính này gồm các u ống dẫn trứng hoặc tử cung và u quái trưởng thành, struma ovarii và leiomyomas buồng trứng. Thuật ngữ này đôi khi cũng bao gồm u ác buồng trứng hoặc di căn của u ác tính đường tiêu hóa.
    Hội chứng Meigs không điển hình [atypical Meigs] đặc trưng bởi một khối vùng chậu lành tính với tràn dịch màng phổi bên phải, nhưng không có báng bụng đã được báo cáo ít nhất hai lần. Như trong hội chứng Meigs, hết tràn dịch màng phổi sau khi loại bỏ u vùng chậu.
    [3]
    Ovarian fibroma in a 45-year-old woman with Meigs syndrome. Transvaginal US image shows a hyperechoic mass in the left adnexa (arrows) with significant acoustic attenuation distal to the mass. These are typical findings in the presence of a stromal neoplasm such as ovarian fibroma.


    Bệnh lý học
    Nguồn gốc dịch báng


    Sinh lý bệnh của báng bụng trong hội chứng Meigs có tính chất suy đoán. Meigs gợi ‎ý rằng một khối u đặc buồng trứng kích thích bề mặt phúc mạc có thể gây tạo dịch phúc mạc. Samanth và Black đã nghiên cứu các u buồng trứng kèm theo báng bụng và nhận thấy chỉ các khối u lớn, có đường kính hơn 10 cm với thành phần nhày [myxoid] của mô đệm [struma] có liên quan đến báng bụng. Các tác giả này cho rằng dịch tiết ra từ khối u là nguồn gốc của báng bụng.
    Các cơ chế khác là do áp lực trực tiếp trên hệ bạch huyết hay mạch máu, kích thích nội tiết tố, và xoắn khối u.. Phát triển báng bụng có thể do phóng thích các chất trung gian (ví dụ, thành phần kích hoạt, histamin, sản phẩm thoái hóa fibrin) từ khối u, dẫn đến tính thấm mao mạch tăng.

    Nguồn gốc của tràn dịch màng phổi
    Nguyên nhân của tràn dịch màng phổi chưa rõ. Efskind và Terada và các cộng sự đưa ra giả thuyết rằng dịch báng bụng được chuyển theo các kênh hệ bạch huyết xuyên cơ hoành. Lượng tràn dịch màng phổi  phần lớn độc lập với lượng dịch báng.

    +   . Nghiên cứu Efskind: Efskind tiêm mực vào bụng dưới một người phụ nữ có hội chứng Meigs và tìm thấy rằng các hạt mực tích lũy trong hệ bạch huyết của bề mặt màng phổi trong vòng nửa giờ. . Gây tắc nghẽn hệ bạch huyết này làm ngăn tích tụ dịch màng phổi và làm dịch báng gia tăng.

    • Nghiên cứu của Terada và cs: Trong năm 1992, Terada và cs tiêm albumin có đánh dấu vào phúc mạc và thấy rằng nồng độ tối đa đã được phát hiện trong màng phổi bên phải trong vòng 3 giờ đồng hồ.

    Bản chất của dịch báng và dịch màng phổi

    . Dịch báng và dịch màng phổi trong hội chứng Meigs có thể là dịch thấm hoặc dịch tiết. . Meigs thực hiện điện di [electrophoresis] ở vài trường hợp và xác định rằng dịch màng phổi và dịch báng tương tự nhau về bản chất. . Kích thước khối u, chứ không phải là loại mô bệnh học cụ thể, được cho là yếu tố quan trọng trong sự hình thành báng bụng và tràn dịch màng phổi kèm theo.
    ......
    Previous
    Nguyên nhân:

    Có thể nghĩ đến ác tính khi có u buồng trứng kết hợp với hội chứng Meigs và tăng CA-125 huyết thanh. Nên giới hạn thủ thuật ngoại khoa khi có kết quả tế bào âm tính của dịch báng, không có di căn phúc mạc, và mô bệnh học lành tính. Nên do phẫu thuật viên  phụ khoa có kinh nghiệm hay chuyên gia ung bướu phụ khoa quyết định.

    • Có những trình ca về  pseudo-Meigs syndrome kết hợp với u mô đệm buồng trứng [struma ovarii] ác tính và tăng CA-125. Chọn lựa không thực hiện điều trị bổ trợ là điều đáng tin cậy sau phẫu thuật tối hảo và thủ thuật định giai đoạn [staging] thích hợp cho tiến trình lành tính về lâm sàng và xuất độ di căn thấp của malignant struma ovarii. Cần tư vấn cẩn thận cho bệnh nhân.
    • Struma ovarii là nguyên nhân hiếm của báng bụng, tràn dịch màng phổi, tăng CA-125 và cường giáp. Tình trạng hiếm thấy này nên được coi là chẩn đoán phân biệt cho những bệnh nhân có báng bụng và tràn dịch màng phổi nhưng có kết quả tế bào âm tính.
    • Báng bụng, tràn dịch màng phổi, tăng CA-125 và không có u ở bệnh nhân lupus đỏ hệ thống cũng là hội chứng Tjalma hoặc do migrated Filshie clips ở pseudo-Meigs syndrome.

     Xét nghiệm CA-125

    Là khảo sát huyết thanh có lợi ngoài serum electrolytes và CBC count. CA-125 huyết thanh có thể tăng trong hội chứng Meigs, nhưng mức độ tăng không tương quan với tình trạng ác tính. Thật ra, CA-125 bình thường không loại trừ khả năng ác tính. CA-125 không được dùng làm xét nghiệm sàng lọc. Sau mổ mức CA-125 cao nhất là 1808 U/mL Đó là kết quả dương tính giả.

    Nguồn gốc sinh l‎ý của CA-125 là thượng bì xoang phôi thai và các dẫn xuất gồm: thượng bì ống
    Müller, màng phổi, màng tim và phúc mạc.
    Các trường hợp bệnh lý tăng CA-125 gồm: viêm phần phụ, tổn hại phúc mạc hay tái tạo (như sau mổ), u buồng trứng ác tính, lạc nội mạc tử cung.

    Vào năm 1992, Lin và cs khảo sát xem có phải u sợi buồng trứng là nguyên do của tăng CA-125 huyết thanh không. Bằng kỹ thuật hoá mô miễn dịch chuyên biệt cho dấu ấn ung thư, đã xác định CA-125 là từ mạc nối lớn và bề mặt phúc mạc hơn là từ u sợi buồng trứng.


    Previous

    Radiologists Losing Money with Incomplete US Documentation


    Radiologists Losing Money with Incomplete US Documentation

    By Marijke Vroomen Durning, RN |May 30, 2012, Diagnostic Imaging News


    Radiologists may be losing income through incomplete physician documentation in abdominal ultrasounds, according to a study published in the June issue of Journal of the American College of Radiology.

    Using a coding and billing database and natural language processing software, researchers reviewed nearly 12.7 million radiology reports from 37 practices to identify and analyze abdominal ultrasound reports. A total of 336,062 abdominal ultrasounds were identified. The exams were categorized as complete or limited, based on standard Current Procedural Terminology (CPT) criteria. Incomplete exams were sub-categorized according to which documentation elements were included.

    Richard Duszak Jr., MD, of The University of Tennessee Health Science Center in Memphis, and colleagues found that 75.1 percent of the reports documented all eight elements for CPT coding as complete examinations, 7.7 percent documented seven elements, 5.6 percent documented six elements, 4.8 percent documented five elements, and 13.5 percent documented four or fewer elements. The researchers found that the spleen was the most frequent element neglected at 41.2 percent.

    Not all organs can be included in the reports, as in cases of absent organs (gallbladders, for example), so the researchers took this into account when determining their documentation deficiency model.

    Thứ Tư, 30 tháng 5, 2012

    Sonographic Findings of Cystic Biliary Atresia and Choledochal Cysts

    Expandof Ultrasound in Medicinewww.jultrasoundmed.org
    Objective Differential Characteristics of Cystic Biliary Atresia and Choledochal Cysts in Neonates and Young Infants: Sonographic Findings

    Lu-Yao Zhou, Bu-Yun Guan, Le Li, Zuo-Feng Xu, Chang-Ping Dai, Wei Wang, Hui-Min Xia, and Xiao-Yan Xie. JUM June 1, 2012 vol. 31 no. 6 833-841

    Abstract

    Objectives— To prospectively evaluate the objective differential characteristics between cystic biliary atresia and choledochal cysts on sonography among neonates and young infants.
    Methods— Twenty-three patients who had sonographic findings of a portal cyst and a final diagnosis were included. Their final diagnoses were cystic biliary atresia in 12 patients and choledochal cysts in 11. All of them underwent detailed sonographic scanning. Data for cystic biliary atresia and choledochal cyst groups were compared by the χ2 test for categorical variables and an unpaired t test for continuous variables.

    Results— The triangular cord sign was detected in 11 patients in the atresia group but in none in the cyst group (P < .001). Nine of 11 patients in the cyst group had dilatation of intrahepatic bile ducts, whereas none in the atresia group had that feature (P < .001). Sonography also showed sludge deposits in the cysts in 6 of 11 patients in the cyst group, whereas none in the atresia group had sludge deposits (P = .005). The mean width and length of the cysts in the cyst group were significantly larger than those in the atresia group (P< .05 for both). The mean hepatic artery diameter was significantly larger in the atresia group than in the cyst group (P < .001). The difference in gallbladder abnormalities between the atresia (n = 11) and cyst (n = 0) groups was also significant (P < .001). When all specific sonographic features were used, all patients were correctly classified into the atresia and cyst groups.
    Conclusions— The triangular cord sign, intrahepatic bile duct dilatation, and echoic cysts might be regarded as objective sonographic features for differentiating cystic biliary atresia and choledochal cysts. Other sonographic features might be very supportive.


    Biliary atresia is a destructive inflammatory obliterative cholangiopathy of neonates and infants that affects varying lengths of both intrahepatic and extrahepatic bile ducts.1 It is an uncommon disorder with a prevalence of about 1 per 5000 in East Asian countries.2 No analogous pathologic process exists in older children or adults. Cystic biliary atresia is a subtype of biliary atresia with portal cysts; it has an occurrence rate of 8% to 11%35 among patients with biliary atresia. Because of its specific appearance, cystic biliary atresia is the only type of biliary atresia that can be detected antenatally with sonography.6 A choledochal cyst in a neonate or young infant is another uncommon entity with an appearance similar to that of cystic biliary atresia on medical imaging. Both are well-known causes of jaundice in neonates and young infants,5 with a cyst at the porta hepatis.
    However, cystic biliary atresia and choledochal cysts are two entities with dramatically different management approaches and prognoses.3,7 Patients with cystic biliary atresia can have a better prognosis with timely and early portoenterostomy.8,9 If they are left untreated, progressive liver cirrhosis leads to death by 2 years of age. Some patients with cystic biliary atresia do not have jaundice relief even after early portoenterostomy. On the other hand, a choledochal cyst is a curable choledochal malformation that can have an excellent prognosis with resection of the cyst and hepaticojejunostomy.5,6 In addition, although there is an opinion that a surgical delay might increase the risk of liver fibrosis in patients with choledochal cysts,3 the optimal time for surgery of choledochal cysts has not been decided yet. Hence, it is very important to differentiate cystic biliary atresia from a choledochal cyst when a portal cyst is found in a neonate or young infant.

    Sonography usually is recommended as the initial tool for evaluating a neonate with jaundice. Some literature has reported that sonography can play an important role in differentiating cystic biliary atresia from a choledochal cyst by characterizing the appearance of the cyst and gallbladder.5,10,11 However, the published literature is sparse, with small sample sizes. Furthermore, the sonographic technique for diagnosis of biliary atresia is still progressing. New sonographic features have been identified, such as the triangular cord sign and hepatic subcapsular flow, which are very effective in identifying biliary atresia. If sonographic features such as those could also be observed in patients with cystic biliary atresia, then there might be new differential characteristics between cystic iliary atresia and choledochal cysts on sonography.

    This study aimed to review the clinical and sonographic features of jaundiced neonates and infants younger than 6 months with a final diagnosis of cystic biliary atresia or a choledochal cyst and to assess the differential characteristics between them.

    Materials and Methods
    A study evaluating the value of sonography for biliary atresia screening among neonates with pathologic jaundice was initiated in July 2009. The study was approved by our Institutional Clinical Research Ethics Committee, and informed parental consent was obtained for every case. Between July 2009 and March, 2011, 263 neonates and infants younger than 6 months who had pathologic jaundice prospectively underwent sonographic screening to rule out biliary atresia. Twenty-six of them showed portal cysts on sonography. Of these, 2 patients who were suspected of having cystic biliary atresia and 1 patient who was suspected of having a choledochal cyst did not undergo surgery in our hospital and were lost to follow-up. As a result, 23 patients who had sonographic findings of a portal cyst and a final diagnosis were included.

    One pediatric radiologist with 3 years of experience in pediatric sonography performed all sonographic examinations. Sonography was performed with an SSA-660A scanner (Toshiba Medical Systems Co, Ltd, Tokyo, Japan) incorporating a 3.5-MHz curvilinear transducer and a 12-MHz linear array transducer and an EUB-7000HV scanner (Hitachi Medical Corporation, Tokyo, Japan) incorporating a 2- to 5-MHz curvilinear transducer and a 6- to 13-MHz linear array transducer. Immediately after detailed scanning, the diagnosis of cystic biliary atresia or a choledochal cyst was made by the pediatric radiologist, who was blinded to the clinical findings for every patient. The patients were not fed for at least 4 hours before the sonographic examinations. During the examinations, the patients were allowed to feed to keep quiet. The presence and thickness of a triangular cord in the porta hepatis and the diameters of the portal vein and hepatic artery were recorded in each case. A triangular cord was defined as a thickness of the echogenic anterior wall of the right portal vein just proximal to the right portal vein bifurcation site of greater than 4 mm.12 The diameter of the hepatic artery was measured at the level of the right proximal hepatic artery running parallel to the right portal vein.13 The maximum width and length of the gallbladder and the cyst were also measured. The presence or absence of dilatation of the intrahepatic bile ducts, the presence or absence of sludge in the cyst, a communication between the gallbladder and the cyst, hepatomegaly, splenomegaly, ascites, and the echogenicity of liver parenchyma were noted during the examinations. The liver was considered enlarged if the right lobe extended below the right kidney. Splenomegaly was defined as a spleen of greater than 6 cm.14

    The gallbladder was classified as normal, atretic, or irregularly elongated. A normal gallbladder was defined as one that was 15 mm or greater in length and globular or ovoid without wall abnormalities. An atretic gallbladder was defined as one that was less than 15 mm in maximum length. An irregularly elongated gallbladder was defined as one that was 15 mm or greater in length and had an abnormal wall with an irregularly compromised lumen. An atretic or irregularly elongated gallbladder was regarded as an abnormal gallbladder.

    Patients with an abnormal gallbladder or the presence of the triangular cord sign on sonography were considered to have cystic biliary atresia. Those with a normal gallbladder and absence of the triangular cord sign were considered to have choledochal cysts. Dilatation of the intrahepatic bile duct and sludge in a large cyst were supportive features of choledochal cysts. Dilatation of the hepatic artery and a small cyst without sludge were supportive features of cystic biliary atresia.

    Cystic biliary atresia was confirmed by surgical cholangiography and pathologic examination in 11 patients and with liver biopsy in 1. Choledochal cysts were confirmed by surgery in 11 patients. Eleven patients with cystic biliary atresia underwent excision of the extrahepatic bile duct, including the cyst, and Roux-en-Y portoenterostomy. The other patient who did not have surgery because he was older than 4 months was confirmed to have biliary atresia by liver biopsy. All 11 patients with choledochal cysts underwent cyst excision and hepaticojejunostomy or choledochojejunostomy.

    The sonographic findings were analyzed with a focus on the presence or absence of a triangular cord, the size of the cyst, the presence or absence of sludge in the cyst, dilatation of the intrahepatic bile ducts and hepatic artery, portal vein diameters, and the sizes and morphologic characteristics of the gallbladder, spleen, and liver. Cyst sizes in cystic biliary atresia between those with a communication between the gallbladder and the cyst and those without were compared. Clinical data such as age, sex, and serum bilirubin level were also recorded and analyzed. Statistical analysis of the two groups was performed with the χ2 test and Fisher exact test for counting data and a t test for measurement data. P < .05 was considered statistically significant. The sensitivity, specificity, and positive and negative predictive values for gallbladder size, gallbladder abnormalities, the triangular cord sign, and sludge in the cyst for predicting cystic biliary atresia were calculated.

    Results

    Final diagnoses were cystic biliary atresia in 12 patients and choledochal cysts in 11. The ages of patients with cystic biliary atresia and choledochal cysts at the time of presentation ranged from 23 to 150 (mean ± SD, 76.4 ± 41.1) and 10 to 120 (60.9 ± 36.4) days, respectively. There were 6 boys and 6 girls in the atresia group and 4 boys and 7 girls in the cyst group. There were no significant differences in age (P = .351) and sex (P = .68) between the atresia and cyst groups.
    The total bilirubin levels in the atresia and cyst groups ranged from 123.2 to 308.0 (208.4 ± 57.4) and 44.9 to 269.4 (150.6 ± 79.7) mmol/L, respectively (P = .113). The direct bilirubin levels in the atresia cyst groups ranged from 93.6 to 226.5 (161.0 ± 39.6) and 34.2 to 190.9 (112.3 ± 56.9) mmol/L (P = .062).
    There were significant differences in the frequency of several sonographic features between the atresia and cyst groups (Table 1). The triangular cord sign was detected in 11 patients (91.7%) in the atresia group (Figure 1) but in none in the cyst group (P < .001). Intrahepatic bile duct dilatation was detected in 9 of 11 patients (81.8%) in the cyst group, whereas none had that feature in the atresia group (P < .001).


    Table 1.

    Comparison of Sonographic Features Between Cystic Biliary Atresia and Choledochal Cysts in Neonates and Young Infants

    Sonography showed a cystic structure in the porta hepatis in all patients in both groups. The sizes (maximum width × maximum length) of the cysts on sonography ranged from 4 × 3 to 47 × 24 mm in the atresia group (n = 12) and 20 × 7 to 130 × 80 
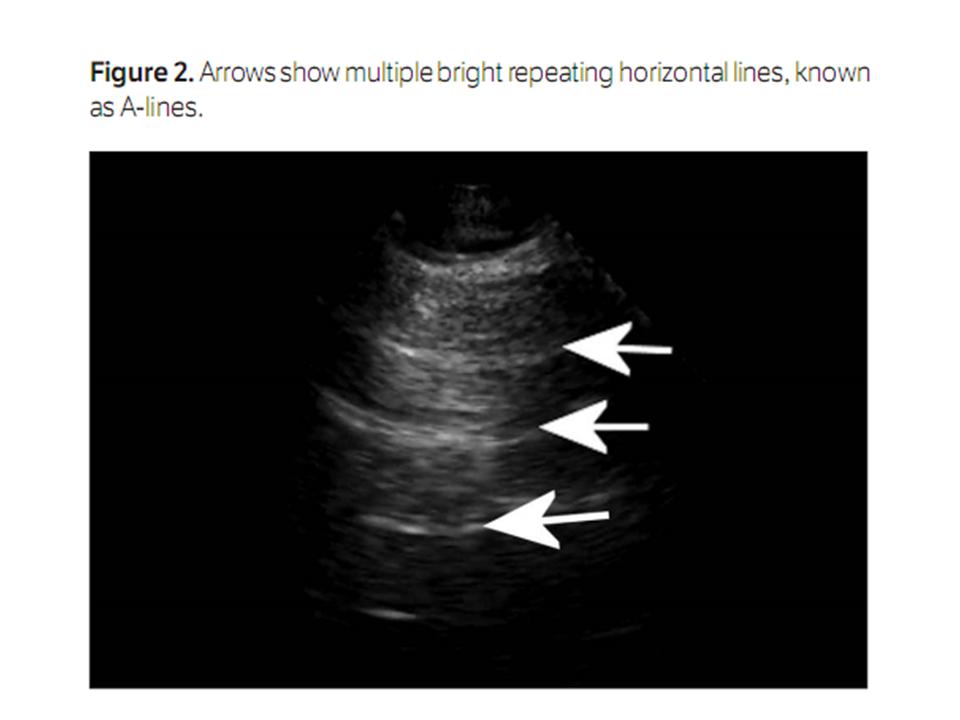
mm in the cyst group (n = 11). Specifically, it was observed that 1 patient with later-stage biliary atresia had 4 cysts (Figure 2) in the porta hepatis, with diameters ranging from 7 to 10 mm; only the largest cyst was taken into account. The mean width and length of the cysts in the cyst group (62.2 ± 39.9 and 41.1 ± 30.7 mm, respectively) were significantly larger than those in the atresia group (16.2 ± 13.2 and 8.9 ± 6.5 mm; P = .002; P = .001). However, the width to length ratios between the two groups were not significantly different (0.64 ± 0.22 versus 0.63 ± 0.20; P = .934). Sludge deposits in cysts were found in 6 of 11 patients (54.5%) in the cyst group (Figure 3), whereas none in the cystic atresia group had sludge deposits (P = .005).
    On sonography, the mean hepatic artery diameter in the atresia group was significantly larger than that in the cyst group (2.4 ± 0.4 versus 1.7 ± 0.2 mm; P < .001), whereas no significant difference was found for the portal vein diameter between the two groups (4.1 ± 0.8 versus 3.8 ± 0.6 mm; P = .373).


    Figure 1.

    Cystic biliary atresia in a 51-day-old girl. A, Cyst (cursors) at the porta hepatis with a size of 46.6 × 23.5 mm. B, Irregularly elongated gallbladder (cursors) with a length of 42.5 mm and a width of 7.8 mm. C, Triangular cord sign (arrows) at the anterior wall of the right portal vein with a thickness of 7.0 mm. D, Enlarged hepatic artery (cursors) with a diameter of 2.4 mm. CY indicates cyst.


    Figure 2.

    Later-stage cystic biliary atresia in a 123-day-old boy. A, Four cysts (arrows) at the porta hepatis with diameters ranging from 7 to 10 mm. Arrowheads indicate an atretic gallbladder with a length of 9 mm. B, Triangular cord sign (arrows) at the anterior wall of the right portal vein with a thickness of 8.0 mm. C, High-frequency image showing fluids around the liver (arrows) and a coarse liver echo texture. D, Color Doppler image showing reopening of the umbilical vein (arrow).

    In the atresia group, sonography showed atretic gallbladders in 2 patients (16.7%), irregularly elongated gallbladders (Figure 1) in 9 (75%), and a relatively normal gallbladder in 1 (8.3%). In the cyst group, all 11 patients (100%) were observed to have normal gallbladders. The morphologic characteristics of the gallbladders between the two groups were significantly different (P < .001). Two patients in the atresia group had gallbladder lengths of less than 15 mm, whereas all patients in the cyst group had gallbladder lengths of greater than 15 mm. However, the mean gallbladder length and the gallbladder width to length ratio were not significantly different in the atresia group (26.4 ± 11.9 and 0.25 ± 0.10 mm) compared with the cyst group (32.7 ± 10.2 and 0.27 ± 0.07 mm; P = .189; P= .476). On the contrary, the mean gallbladder width in the atresia group (5.6 ± 2.0 mm) was significantly smaller than that in the cyst group (8.5 ± 2.5 mm; P = .005).
    Sensitivity, specificity, and positive and negative predictive values for gallbladder size, gallbladder abnormalities, the triangular cord sign, and sludge in the cyst for predicting cystic biliary atresia are shown in Table 2. When all specific sonographic features were taken into account, all patients were correctly classified into the atresia and cyst groups, for an overall accuracy rate of 100%.

    Six of 12 patients (50%) in the atresia group were observed to have a communication between the gallbladder and portal cyst on sonography, which was later confirmed by intraoperative cholangiography. The cyst sizes were different between those who had a communication between the gallbladder and cyst and those who did not. The length of those with a communication (n = 6) ranged from 11 to 47 (25.5 ± 13.1) mm, whereas the length of those without a communication (n = 6) ranged from 4 to 10 (6.8 ± 2.3) mm (P = .006).
    Two patients in the atresia group had an abnormal coarse liver echo texture and a reopened umbilical vein (Figure 2) on sonography. One of them also had ascites. All patients in the cyst group had a normal liver echo texture, and no ascites was detected.

    Discussion
    Sonography has been considered very helpful in making a preoperative differential diagnosis between cystic biliary atresia and choledochal cysts.5,10,15,16 Patients with larger cysts, dilated intrahepatic ducts, and normal gallbladders are more likely to have choledochal cysts. Inversely, those with smaller cysts, nondilated intrahepatic ducts, and abnormal gallbladders are more likely to have cystic biliary atresia. However, debates still exist as to this point of view. Some authors have reported cystic biliary atresia with large cysts or with dilated intrahepatic ducts.5,9,16 In addition, it is hard to draw a clear line between a large cyst and a small cyst. Some authors proposed that the shape of the cyst might play a role in distinguishing cystic biliary atresia from a choledochal cyst5,10 because the cysts in cystic biliary atresia were more likely to be teardrop shaped, whereas the choledochal cysts were more likely to be fusiform. However, we thought it was a little too subjective to differentiate cystic biliary atresia from choledochal cysts by judging the shape of the cysts. Some more specific and objective sonographic features for differentiating the diagnosis are urgently needed.

    The state of the art in diagnosis of biliary atresia by sonography has been updated in recent years. Apart from gallbladder abnormalities, other sonographic features have been identified as useful in identifying biliary atresia, such as the triangular cord sign, dilatation of the hepatic artery, and hepatic subcapsular flow. The triangular cord sign was considered an objective criterion for identifying biliary atresia on sonography.12 Although the sensitivity of this sign for identifying biliary atresia varies, it is widely considered a specific sonographic marker of the disease, with specificity ranging from 96% to 100%.12,1720 Enlargement of the hepatic artery in infants with biliary atresia was also reported.13,19,21 With a critical diameter of 1.5 mm, the sensitivity and specificity of an enlarged hepatic artery for identifying biliary atresia were 92% and 87%, respectively.13 Hepatic subcapsular flow, defined as vascular structures contiguous with the liver capsular surface on color Doppler sonograms, was found to have sensitivity of 100% and specificity of 86% for identifying biliary atresia.21 A combination of all of these features could improve the accuracy of sonography for diagnosis of biliary atresia to 98% to 100%.1719 However, few studies in the literature have assessed the value of these sonographic features for differentiating cystic biliary atresia from choledochal cysts.


    Table 2.

    Specific Sonographic Features as Predictors of Cystic Biliary Atresia

    In this study, we found that the triangular cord sign and a dilated hepatic artery are very useful for differentiating cystic biliary atresia from noncystic biliary atresia. The triangular cord sign was detected in 11 of 12 patients (91.7%) in the atresia group, whereas no patient in the cyst group had this sign. The sensitivity and specificity of the triangular cord sign were 91.7% and 100%, respectively. Although the triangular cord sign was not observed in 5 cases of cystic biliary atresia10 because of the negative effect of the cyst at the porta hepatis, we thought that the triangular cord sign could be detected by an experienced operator performing careful scanning. However, it should be noted that not every case of cystic biliary atresia might show the triangular cord sign. The incidence of the triangular cord sign among patients with cystic biliary atresia needs to be further assessed with more cases. We also showed that the caliber of the hepatic artery is significantly larger in patients with cystic biliary atresia, which is the same as that in patients with isolated biliary atresia. We think that the reason for this finding is the same as for that in isolated biliary atresia, even if the latter is still not known clearly.22 Although there is still no standard critical value for determining a larger hepatic artery from normal, we think that a prominent hepatic artery can be supportive in differentiating cystic biliary atresia from choledochal cysts. Nevertheless, we have to confess that measurement of the hepatic artery in patients with larger cysts at the porta hepatis was very difficult.


    Figure 3.

    Choledochal cyst in a 74-day-old boy. A, Cyst at the porta hepatis with a size of 52.1 × 50.0 mm. At the bottom of the cyst, sludge (arrow) without a posterior acoustic shadow is shown. B, Normal gallbladder (cursors) above the cyst with a size of 22.3 × 4.5 mm. C, Dilated intrahepatic bile duct (arrow) with a diameter of 1.7 mm. D, Hepatic artery (arrow) with a diameter of 1.8 mm. CY indicates cyst.

    We confirmed that an abnormal gallbladder is very critical for distinguishing between cystic biliary atresia and choledochal cysts on sonography. Although some authors reported that the gallbladder length in biliary atresia is usually smaller than that in nonbiliary atresia,19,20 when it comes to cystic biliary atresia and choledochal cysts, this conclusion might not be applicable.10 In this study, the occurrence of only 2 gallbladders (16.7%) in the cystic biliary atresia group with a length of less than 15 mm was dramatically smaller than that in isolated biliary atresia. Furthermore, the mean gallbladder length in the atresia group was not significantly smaller than that in the cyst group in this study. We think that it is the shape and not the size of the gallbladder that is useful for differentiating cystic from noncystic biliary atresia. As reported in the literature,5,10 the shape of the gallbladder in patients with cystic biliary atresia was much more likely to be irregularly elongated in our study, with a frequency of 75% (9 of 12).
    The mean cyst size in the atresia group was smaller than that in the cyst group in our study. This result was the same as what most authors have noted.5,10,11 However, a cyst in a patient with cystic biliary atresia with a diameter of 80 mm reported by Caponcelli et al9 is clearly an exception to this outcome. Kim et al5 noted that it is useful to differentiate cystic biliary atresia from a choledochal cyst by the shape of the cyst. However, it is a little too subjective to define the shape as a teardrop, fusiform, or ovoid. In this study, we compared the cyst length to width ratios between the cyst and atresia groups, and the difference was not significant, which we consider a supportive point for our opinion.
    In this study, 6 patients (54.5%) with choledochal cysts had sludge deposits, whereas no cyst with sludge was found in the patients with cystic biliary atresia. Similarly, Casaccia et al15 reported that echoic cysts were strongly suggestive of choledochal cysts. This finding could be explained by the pathologic changes that occur in these two entities. A choledochal cyst is an abnormality in which only the distant extrahepatic bile duct might be obstructive, whereas the proximal bile duct is patent. With the bile continuing to be secreted and flowing into the cyst, some components in the bile deposit and become sludge. On the contrary, biliary atresia is usually an entity with obliteration of the hepatic bile duct or the most proximal part of the extrahepatic bile duct.1 Hence, the bile flow cannot reach the cyst, and the fluid in the cyst does not contain the necessary components to form sludge. The white cystic fluid in cystic biliary atresia found during surgery23 might support this explanation. In addition, the reason why the intrahepatic bile ducts of choledochal cysts are more likely to be dilated than those of cystic biliary atresia was also explained. In our study, the incidence of dilated intrahepatic bile ducts in the cyst group was 81.8% (9 of 11), which was comparable to incidence rates of 47.7% to 100% noted by other authors.5,10

    In this study, we also noted that one 123-day-old patient with later-stage biliary atresia had multiple cysts at the porta hepatis. We speculated that these might have been secondary intrahepatic biliary cysts caused by the ongoing process of hilar bile duct obstruction. Generally, multiple intrahepatic biliary cysts occur more often in postoperative biliary atresia. However, a few cases of cystic biliary atresia with multiple intrahepatic biliary cysts found before surgery have been reported.24

    The main limitation of our study was that we did not correlate the triangular cord sign with the location of the cystic biliary atresia because of a lack of related information. However, we think that there might be a correlation between the presentation of the triangular cord sign and the location of the biliary atresia. Another limitation of our study was that the sample was very small. Large clinical trials are required to further test our findings.

    In conclusion, with the use of a combination of all specific sonographic features, all 23 patients in our study were correctly classified as having cystic biliary atresia or choledochal cysts. Although measurements of the cyst size and hepatic artery diameter could be supportive points for differentiating cystic biliary atresia from choledochal cysts, we think that the triangular cord sign, gallbladder abnormalities, intrahepatic bile duct dilatation, and echoic cysts might be more valuable sonographic features for differentiating cystic biliary atresia from choledochal cysts. Furthermore, the triangular cord sign, intrahepatic bile duct dilatation, and echoic cysts might be regarded as objective sonographic features for distinguishing between cystic biliary atresia and choledochal cysts because they can be detected objectively on sonography.
          © 2012 by the American Institute of Ultrasound in Medicine.

    Lung Ultrasound in Evaluation of Pneumonia

    Lung Ultrasound in Evaluation of Pneumonia

    Michael Blaivas, J Ultrasound Med 2012; 31:823–826 |www.aium.org

    During the last 20 years, ultrasound has been shown to be highly effective in evaluating a range of pathologic pulmonary conditions. One of the most widely studied and practiced applications is the evaluation of pneumonia with ultrasound. Ultrasound interrogation of the thorax for detection of pneumonia has been explored most in critical care and emergency department settings. However, recently, the application has spread to general practice and even prehospital settings. A number of scanning approaches exist, ranging from highly involved research scanning tools to rapid and focused surveillance scans. The most widely accepted protocol is performed rapidly and easily and has proved to be sensitive and specific in adult and pediatric patients. Multiple studies have shown lung ultrasound imaging to be more accurate than chest radiography and in some cases rivals the accuracy of computed tomography (CT), such as in the diagnosis of lung abscesses. This article reviews clinical scenarios in which the lung ultrasound examination is useful in suspected pneumonia, describes pathologic findings, and presents a commonly accepted scanning protocol.

    Overview and Clinical Problem

    The diagnosis of pneumonia, once thought to be accomplished simply by physical examination, history taking, and specific auscultatory findings, has recently become highly dependent on imaging. There is, in general, a method behind this apparent clinical madness. Despite a long-held belief that physical examination findings and proper auscultation are sufficient to rule in, or out, the presence of pneumonia, multiple pressures in clinical practice have driven increased use of chest radiography and occasionally CT. The physical examination has proved to be unreliable for detection of pneumonia, even in expert hands.1 Studies comparing examinations by expert physicians to chest radiography have verified the failure of auscultation as a diagnostic method in evaluation of pneumonia, yet physicians are under an increasing burden to be more accurate, and missing pneumonia is seen as a substantial liability. Additionally, the common approach in general private practice of prescribing antibiotics to any patient presenting with a cough and fever contributes to increasing antibiotic resistance and is actively combated by the US Centers for Disease Control and Prevention.

    When faced with a patient with any combination of fever, cough, shortness of breath, and hypoxia, clinicians think they have little option but to obtain an imaging study or empirically prescribe antibiotics. In hospital settings, patients may receive chest radiography routinely, not only for most presentations to the emergency department with a cough but also in hospital wards and intensive care units. In the latter two locations, chest radiography may be a daily occurrence for some patients. However, one of the most clinically frustrating aspects of searching for pneumonia with chest radiography is the relatively low accuracy of this traditional imaging standby. Clinicians frequently discover pneumonia on CT that was not seen on chest radiography while searching for other pathologic conditions such as pulmonary embolisms. Additionally, common chest radiography is associated with considerable practical delays in most settings where a trained technologist obtains an image and then processes it, both frequently away from the immediate clinical setting. Point-of-care ultrasound imaging, performed at the patient’s bedside, decreases the delays of chest radiography in diagnosis of pneumonia. Studies showing the efficacy of lung ultrasound in detecting and ruling out pneumonia date back approximately 20 years. Originally unrecognized by most in the medical community, ultrasound imaging has proved superior to chest radiography in almost every setting ranging from intensive care units to emergency departments and outpatient clinics.2,3 The term “lung ultrasound” is the most widely accepted one but is effectively equivalent to “thoracic ultrasound” and “pleural ultrasound,” both of which have occasionally been used in the literature.

    Ultrasound Use

    Performing the examination is easy and can be accomplished after focused training. The original descriptions used a micro-convex ultrasound transducer in the 5-MHz range. Little or no image postprocessing was available at the time, and much of the science of lung ultrasound was built on artifacts noted when the ultrasonic waves hit the pleural surface. In recent years, a variety of ultrasound transducer types have been used to image the lung. The most common, in addition to the micro-convex type, are linear and phased array cardiac transducers, typically ranging from 10 to 5 and 5 to 2.5 MHz, respectively. The linear arrays, much like a curved linear abdominal probe, have difficulty getting in between ribs, substantially limiting imaging in some patients. However, the pleura and near-pleural abnormalities are seen much better than with the micro-convex and phased array transducers, which are probably best suited for general lung applications such as pneumonia screening in most patients. In the adult patient, the field depth is typically set at 16 to 18 cm, commonly found on most machine presets. Image postprocessing settings such as tissue harmonics and multibeam functions are best turned off if possible. Such settings may eliminate artifacts and could impede diagnosis. The ultrasound transducer is moved until a rib interspace is located. The probe is then panned horizontally and vertically to the extent possible to allow the broadest sweep through the area being imaged. The transducer indicator is pointed cephalad and then to the patient’s right, allowing for the best ultrasound penetration between ribs. Holding the transducer perpendicular to the chest wall and panning of the beam are accomplished with subtle movements and angle variations. For the most consistent and accurate results, the operator should use a methodical scan to map out the entire thorax. The micro-convex and phased array transducers are ideal for manipulating the ultrasonic beam in the rib interspaces. One exception is the young pediatric patient, for whom linear array or high-resolution micro-convex transducers are best suited to the small body size.


    Figure 1.

    The scanning position for the lateral chest is shown. A phased array cardiac transducer was used for this 8-point pneumonia survey.

    When evaluating for pneumonia, the ultrasound transducer is typically applied to 4 different windows on each hemithorax. In a reclined or semireclined patient, the 8 regions include the upper and lower regions of the anterior hemithorax and upper and lower regions of the lateral hemithorax (Figure 1). An entire region is surveyed by angling and sliding the ultrasound transducer as needed. The pleural surface of the lung acts as an acoustic reflector, reflecting nearly 80% of the ultrasonic beam it encounters. As seen with other anatomic structures with high impedance, horizontal reverberation artifacts are readily created and are known as A-lines in the lung ultrasound lexicon (Figure 2). The healthy, well-aerated, and inflated lung has a density of approximately 0.32 g/mL and is not acoustically penetrated by medical ultrasound to an appreciable degree.4 When the fluid content of the lung increases, substantial impedance differences are encountered in close proximity, leading to generation of additional artifacts termed B-lines, which are frequently seen in pulmonary edema. These artifacts are classically described as discrete laser-like vertical hyperechoic entities, which appear to arise at the pleural line and extend to the bottom of the ultrasound image without fading. Debate still exists about their exact source.


    Figure 2.

    Arrows show multiple bright repeating horizontal lines, known as A-lines.

    The key to ultrasound visualization of pneumonia in the lungs is relative loss of aeration of a portion of the lung and a concomitant increase in the fluid content, which is seen in lung consolidation. Once this consolidation reaches the pleura, it can be seen with ultrasound. Although some very early pneumonias must be so localized as to not abut the lung pleura, most make contact at some point inside the chest in clinically symptomatic patients and can thus be imaged with ultrasound. Current literature suggests that most pneumonias in critically ill patients (up to 98%) will contact the pleura.5 On a standard ultrasound examination, lung consolidation from pneumonia is often described as having a tissue-like pattern and is referred to as “hepatization” to illustrate its gray scale density and general appearance (Figure 3). Boundaries of a consolidated lung segment are defined by the pleural line, the adjacent aerated lung, and any effusion that may be present. The boundary created by adjacent aerated lung will naturally appear irregular. An exception is when an entire lobe is affected, in which case the boundary will be regular and well defined. A dendrite-like air bronchogram and a large number scatter artifacts from air are frequently traceable up to the pleura (Figure 4). In real time, air can be seen moving through bronchi, and this finding is known as a dynamic air bronchogram (Video 1). On color or power Doppler imaging, vascular flow in cases of pneumonia is seen as a classic branching pattern in the infected/consolidated lung. Table 1 summarizes the typical ultrasound findings associated with pneumonia.


    Figure 3.

    This image shows a solid organ–appearing structure in the near field. In actuality, the scan was performed through the lateral thorax. The lung is consolidated in a case of pneumonia and has an echo texture similar to that of the liver (Lung). Adjacent to it, the heart is shown, which is not possible through healthy lung. Several vessels are shown near the heart with a great vessel (GV).


    Figure 4.

    This image shows air bronchograms. The liver is shown on the right side of the screen with the diaphragm just to the left. The content of the thorax above the diaphragm is easily visualized (Lung) and appears to have a liver-like echo texture. Arrows point to bright branching signals within the consolidated lung, which represent the air bronchograms.

    The sensitivity of B-mode ultrasound imaging is about 90%.5 Consolidation and dynamic air bronchograms have the highest specificity for pneumonia. Several studies showed that ultrasound imaging outperformed chest radiography with CT of the chest as a reference standard.2,610 Interestingly, lung ultrasound has grown to such an extent that an evidence-based consensus conference was held in 2010 and 2011, grading supporting evidence and bringing together dozens of published experts from multiple countries around the world.11 The consensus conference found lung ultrasound to have broad utility in evaluating patients for pneumonia, lung contusions, pneumothorax, pulmonary edema, pulmonary embolisms, and other pathologic conditions. In general, ultrasound imaging performed better than plain radiography.


    Table 1.

    Most Common Ultrasound Findings Associated With Pneumonia

    Discussion

    Lung ultrasound imaging for the detection of pneumonia is highly accurate but like most diagnostic tests is not perfect. It is important for the sonologist to realize that lung consolidation can result from several different pathologic conditions. These include not only pneumonia but also acute respiratory distress syndrome (ARDS), lung contusions, and atelectasis. Although differentiating between pneumonia and atelectasis is probably the most difficult on the basis of clinical grounds, it is easily accomplished with ultrasound. Atelectatic lung segments (clinically the most commonly encountered mimickers) will show the absence of regional blood flow in the affected area of the lung on color or power Doppler interrogation. Patients with ARDS and lung contusions are often obviously clinically but will show the presence of blood flow on Doppler imaging. Lung contusions are typically encountered in patients with blunt trauma and will show abolishment of lung sliding; in some cases, they have even been mistaken for pneumothorax. However, contusions will also show localized signs of pulmonary edema and asymmetry between the left and right lungs, which can help differentiate them from pneumonia. On the other hand, ARDS will almost always show pleural line irregularities and will frequently show subpleural consolidation. These signs can allow clinicians to distinguish between major causes of lung consolidation on ultrasound imaging. As with any ultra-sound application, operator competency is critical, and error can occur if the operator is not properly trained and experienced. Fortunately, it appears that lung ultrasound imaging has a favorable learning curve. However, misdiagnosis of pneumonia or, worse, failing to detect pneumonia could negatively affect the patient.

    The use of lung ultrasound in the evaluation of pneumonia is growing rapidly and in each clinical setting shows increased efficiency as accurate bedside diagnosis is made possible. Although many traditional imaging applications are still indicated and will be used indefinitely for patients with possible pneumonia, lung ultrasound can substantially decrease the practical delays associated with plain chest radiography and in some cases can obviate the need for chest CT when a definitive diagnosis is obtained on ultrasound imaging, avoiding a large radiation dose. In many cases when pneumonia is in the differential diagnosis, lung ultrasound should come first.

    Footnotes

           The Sound Judgment Series consists of invited articles highlighting the clinical value of using ultrasound first in specific clinical diagnoses where ultrasound has shown comparative or superior value. The series is meant to serve as an educational tool for medical and sonography students and clinical practitioners and may help integrate ultrasound into clinical practice. 

    Chủ Nhật, 27 tháng 5, 2012

    Physician Interpretation Time Reduced by Automated Breast Ultrasound


    Physician Interpretation Time Drastically Reduced by Automated Breast Ultrasound

    By Medimaging International staff writers
    Posted on 23 May 2012


    Automated breast ultrasound takes an average three minutes of a physician’s time, allowing for faster and more complete breast cancer screening of asymptomatic women with dense breast tissue, a new study revealed.

    Mammography misses more than one-third of tumors in women with dense breasts, according to Rachel Brem, MD, lead author of the study. “Ultrasound can and does detect additional, clinically significant, invasive, node negative breast cancers, that are not seen on mammography, but a hand-held ultrasound screening exam requires 20-30 minutes of physician time. Having a technique that takes just three minutes is a “game-changer” in appropriately screening these women,” said Dr. Brem.

    The study, conducted at George Washington University Medical School (Washington DC, USA), quantitatively evaluated the time it took for radiologists to interpret automated breast ultrasound examinations. The average reading time for the three radiologists in the study was 173.4 seconds, said Dr. Brem.

    Currently, automated breast ultrasound is limited in use, although a US Food and Drug Administration (FDA) panel just recently voted in favor of its efficacy and safety. “When automated breast ultrasound is integrated in the screening environment, we will see the detection of smaller, more curable breast cancers. The days of one size fits all approach to breast screening are passing.

    Automated breast ultrasound provides us with a tailored approach based on the individual woman’s breast density,” Dr. Brem said. “When the Food and Drug Administration clears automated breast ultrasound for screening, I’m confident we will see a rapid integration of this approach into practice to improve cancer detection in women with dense breasts,” she said.

    The study was presented May 5, 2012, at the American Roentgen Ray Society annual meeting in Vancouver (BC, Canada).