Tổng số lượt xem trang

Thứ Ba, 8 tháng 1, 2013

SIÊU ÂM ĐÀN HỒI TRONG NIỆU KHOA

.
SIÊU ÂM ĐÀN HỒI TRONG NIỆU KHOA
NGUYỄN THIỆN HÙNG- PHAN THANH HẢI, TRUNG TÂM Y KHOA MEDIC HOÀ HẢO, Thành phố Hồ Chí Minh

Siêu âm vốn có vai trò quan trọng trong chẩn đoán bệnh niệu khoa cấp và mạn tính như cơn đau quặn thận, xoắn tinh hoàn, chấn thương thận, hoặc dùng theo dõi hồi lưu bàng quang niệu quản, đánh giá vô sinh, đo thể tích nước tiểu tồn lưu và phát hiện ung thư. Tuy nhiên có một số mặt siêu âm có độ chính xác chưa đủ tin cậy và phải được CT và MRI xác nhận.

Khám siêu âm không tốn kém chi phí và thời gian nhiều, không ảnh hưởng tia xạ và theo lệ [routine] do bác sĩ và lịch khám lâm sàng. Với công nghệ mới như siêu âm với chất cản âm hay siêu âm đàn hồi, các ứng dụng siêu âm càng được mở rộng.

Bài này nhằm đề cập khái quát về siêu âm đàn hồi và vài ứng dụng tại thành phố HCM từ 2004 đến nay.


ÁP DỤNG SIÊU ÂM ĐÀN HỒI TẠI TP HỒ CHÍ MINH:

Trên thị trường thành phố hiện có các máy siêu âm để phân tích định tính và định lượng độ căng mô (tissue strain), độ cứng (stiffness). Phân làm 2 loại chính:  tĩnh [static]  và động [dynamic].


*static= với nguồn kích thích cơ học trực tiếp: compression elastography hay strain imaging, như máy Philips, GE, Hitachi với Hitachi Real-Time Tissue Elastography (HiRTE).

*dynamic= với lực bức xạ (radiation force) gây ra đàn hồi thoáng qua [transient elastography].

- Transient elastography (như Fibroscan®)
- Supersonic Shear Imaging : với sóng biến dạng [shear wave] (như Supersonic Imagine Aixplorer)
 - ARFI imaging: với xung lực bức xạ âm [Acoustic Radiation Force Impulse (ARFI)] như Acuson Siemens S2000

Siêu âm đàn hồi phản ánh độ cứng của tổn thương, cách khám như siêu âm thường quy với đầu dò siêu âm có tích hợp kỹ thuật đàn hồi. Đã có nhiều bằng chứng trong y văn cho thấy siêu âm đàn hồi làm giảm việc sinh thiết không cần thiết, tăng cường chẩn đoán chính xác các bệnh lý u vú và gan.
Trung tâm Y khoa Medic Hoà Hảo hiện đang sử dụng máy FibroScan (FS), máy Supersonic Imagine (supersonic shear imaging, SSI) và  máy Acuson S2000 (ARFI) cho các loại bệnh lý tuyến vú, tuyến giáp, theo dõi xơ hoá gan, bệnh lý cơ khớp, phần mềm và da.

Trong Niệu khoa, có các lĩnh vực có đóng góp của siêu âm đàn hồi là  nốt tinh hoàn, u thận, tiền liệt tuyến và theo dõi thải ghép thận.

1/ TINH HOÀN: 

Với real-time elastography của máy Hitachi, Goddi và cs đã phân biệt các nốt và giả nốt (nodular/pseudonodular) của tinh hoàn bằng phần mềm cho điểm SC từ 1-5. Một báo cáo gồm 144 tổn thương của 88 tinh hoàn cho thấy 93,7% nốt lành tính có complete elastic pattern SC 1; 92,9% nốt   lành tính nhỏ hơn 5mm và 100% tổn thương giả nốt cũng có SC 1; trong khi 87,5% nốt ác tính có SC 4-5 (cứng). RTE giúp phân biệt nốt lành tính và ác tính tốt hơn; có độ nhạy=87,5%, độ đặc hiệu=98,2% và độ chính xác là 95,8% khi phân biệt nốt tinh hoàn lành tính và ác tính. Tuy nhiên RTE ít có liên quan với những tổn thương lớn.


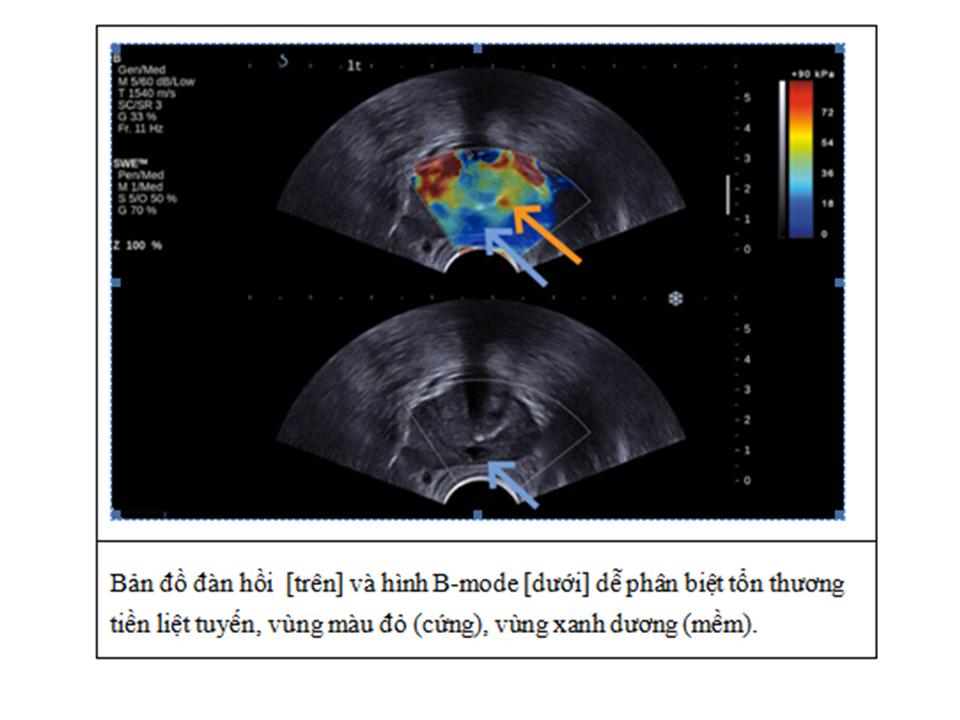
2/ TIỀN LIỆT TUYẾN= Siêu âm đàn hồi qua ngã trực tràng
  • Real–time Sonoelastography của máy Hitachi
  • Shear Wave Elastography của máy Supersonic Imaging
 Máy Aixplorer’s ShearWave  Elastography với đầu dò transrectal  dễ phát hiện các nhân tiền liệt tuyến. Bản đồ đàn hồi mã hoá màu định lượng độ cứng tiền liệt tuyến hiển thị real–time và chỉ cần ấn 1 nút. Bản đồ giúp định vị và phân biệt sự mất đồng dạng của tuyến tiền liệt và theo dõi sau điều trị mà không phụ thuộc người khám và có tính lập lại. Ngoài ra có thể sinh thiết dựa vào cùng lúc hình B-mode và hình đàn hồi, làm tăng độ chính xác của sinh thiết.


3/ BỆNH THẬN MẠN (CKD) và GHÉP THẬN

Số bệnh nhân bệnh thận mạn (chronic kidney disease, CKD) và tiếp sau đó là bệnh lý thận giai đoạn cuối (end-stage renal disease, ESRD), gia tăng và không được đánh giá đúng mức. Bệnh thận giai đoạn cuối tăng nhiều trong thập niên qua do các yếu tố tiên phát như cao huyết áp, tiểu đường, tăng lipid máu, béo phì hay nghiện thuốc lá.

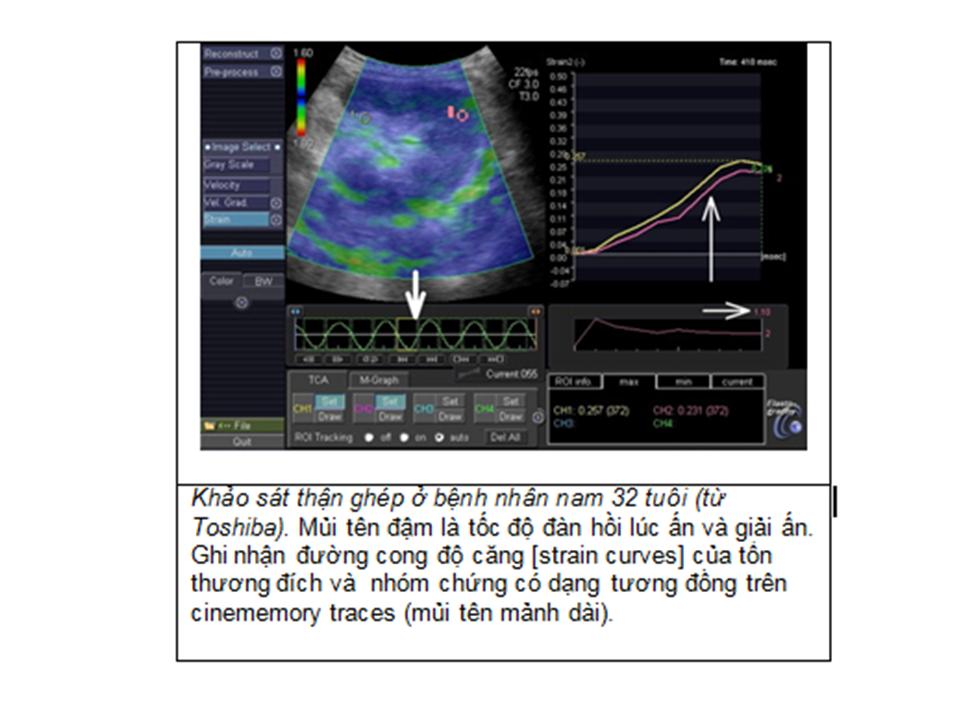
Supersonic Shear Imaging (SSI) được chứng minh có khả năng theo dõi định lượng xơ hóa thận (kidney fibrosis) trên chuột và sau đó, được áp dụng trên người. Có các nghiên cứu với đầu dò cong và bản đồ đàn hồi nhày (viscoelastic properties) của thận người ghép ở cơ thể sống và đối chiếu với sinh thiết.
Một nghiên cứu theo dõi trong 8 tuần trên nhóm 50 chuột bị làm xơ hóa vi cầu thận (glomerulosclerosis) bằng L-Name nhằm khảo sát độ chính xác của kỹ thuật. Bản đồ đàn hồi định lượng của vỏ thận được thực hiện với đầu dò linear 8 MHz. Còn trên thận người ghép, bản đồ đàn hồi định lượng của vỏ thận được thực hiện với đầu dò cong 2,5MHz.
Kết quả trên động vật cho thấy có sự gia tăng độ đàn hồi vỏ thận từ 9-25kPa. Kết quả được đối chiếu với mô học như tiểu đạm và/hoặc định lượng xơ hóa với 3 màu.
Trên thận người ghép có 3 nhóm được khảo sát: nhóm chứng, nhóm đối tượng thận ghép không hoạt động sớm và nhóm thận ghép không hoạt động muộn. Kết quả thu thập được ở 49 bệnh nhân với bản đồ đàn hồi ở sâu 8cm và rộng 10cm cho thấy độ đàn hồi thay đổi giữa các nhóm, tăng từ 9 đến 50kPa. Đối chiếu với mô học đạt được sự thống nhất về các dấu hiệu xơ hóa và độ đàn hồi. Như vậy, độ đàn hồi có liên quan với xơ hóa thận.


Vì hầu hết diễn tiến xơ hóa thận là do bệnh viêm thận mạn, việc xác định không xâm lấn và theo dõi diễn tiến này hẵn sẽ làm thay đổi dự hậu bệnh lý thận, nếu như bệnh nhân được áp dụng các điều trị trúng đích (targeted therapies).


Với siêu âm đàn hồi  ARFI của máy ACUSON S2000, gồm 2 kỹ thuật là  VTQ (Virtual Touch Tissue Quantification : đo định lượng tốc độ sóng biến dạng trong vùng khảo sát ROI, tốc độ đàn hồi SWV [shear wave velocity] càng lớn mô thận ghép càng cứng do fibrosis) và VTI  (Virtual Touch Tissue Imaging, định tính độ cứng tương đối vùng ROI, tổn thương tối hơn [darker] mô xung quanh thì càng cứng hơn mô xung quanh). Với giá trị cut-off của vận tốc đàn hồi VTQ chủ mô thận của thải ghép ở phần dưới (chỗ sinh thiết) SWV=2,81m/s, độ nhạy là 75% và độ đặc hiệu là 64,7%, ROC=0,78 với p=0,004 (Jeong Yeon Cho, 2010).

Kỹ thuật siêu âm đàn hồi  ARFI có vai trò tiên lượng không xâm lấn trong bệnh thận thải ghép thận mạn tính (chronic allograft nephropathy, CAN) do xơ hóa mô kẽ và teo ống thận (interstitial fibrosis and tubular atrophy) và theo dõi diễn tiến của xơ hoá mô kẽ và teo ống thận.

  
4/ U THẬN:


Dùng siêu âm đàn hồi ARFI để phân biệt carcinôm tế bào thận[renal cell carcinoma, RCC] với u AML [angiomyolipoma], Jeong Yeon Cho (2010), giả định RCC, đặc biệt là clear cell type, cứng hơn chủ mô thận và u AML. Ở 18 ca u thận nhỏ dưới 5 cm ở 16 bệnh nhân, với VTI chỉ số ratio of gray scales của khối u với vỏ thận (T/KG) và với VTQ, chỉ số ratio of SWVs của khối u với vỏ thận (T/KSWV) đều khác biệt.


Tóm lại, siêu âm đàn hồi mô, cả định tính--như với static elastography--hoặc bằng cách sử dụng phương pháp dynamic để tracking (theo dõi) sóng biến dạng, là kỹ thuật đàn hồi phong phú và phát triển nhanh, hứa hẹn cải thiện chẩn đoán cho nhiều bệnh lý trong lĩnh vực niệu khoa và các chuyên khoa khác. Tuy nhiên do còn non trẻ, kỹ thuật siêu âm đàn hồi cần được cân nhắc khi áp dụng, thận trọng khi đọc kết quả để tránh những cạm bẫy do kinh nghiệm còn ít.

Chú thích:

1. Shear Wave:  sóng biến dạng, còn gọi là sóng ngang, là một biến dạng đàn hồi thẳng góc với hướng chuyển động của sóng.
Compression Wave:  sóng đè nén, còn gọi là sóng dọc, là một đè nén vào môi trường.
2. Lực bức xạ âm (acoustic radiation force)  là kết quả từ momentum transfer (chuyển đổi động lượng) từ sóng siêu âm lan truyền đến mô. Có các phương thức áp dụng lực bức xạ âm: tĩnh (static), thoáng qua (transient), hoặc có tính hoà âm (harmonically).
3. Elasticity Imaging Methods: Ngoài kích thích cơ học là chuyển động mô sinh lý (mạch đập), nếu=
    - dùng nguồn rung động (vibration) từ ngoài để tạo sóng biến dạng trong mô= sonoelasticity.
    - dùng nguồn nén tĩnh bên ngoài (external static compression) để kích thích cơ học = strain imaging.
    - thuận tiện hơn 2 cách từ ngoài đã kể ở trên, dùng lực bức xạ âm (Sugimoto đề xuất đầu tiên, 1990) kết hợp trực tiếp trong mô = shear wave elasticity imaging (Sarvazyan và cs, Nightingale và cs, Bercoff và cs., Fink và cs).
4. Young's modulus= giá trị tuyệt đối đàn hồi Young, mô tả  biến dạng theo chiều dọc với áp lực dọc.
5. Shear modulus= liên quan với biến dạng theo chiều ngang và được liên hệ với truyền sóng biến dạng trong môi trường đồng nhất đẳng hướng (isotropic homogeneous media).
6. Bulk modulus=của độ đàn hồi mô tả thay đổi thể tích của vật chất do kích thích từ ngoài.

Tài liệu tham khảo chính:
1. Éric Bavu, Jean-Luc Gennisson, Mathieu Couade, Jeremy Bercoff, Vincent Mallet, Mathias Fink, Anne Badel , AnaÏs Vallet-Pichard, Bertrand Nalpas, Mickaël Tanter, Stanislas Pol: Noninvasive In Vivo Liver Fibrosis Evaluation Using Supersonic Shear Imaging: A Clinical Study on 113 Hepatitis C Virus Patients, Ultrasound in Medicine and Biology, Volume 37, Issue 9 , Pages 1361-1373, September 2011.
2. Stanislav Emelianov: Ultrasound Elasticity Imaging, University of Texas.
3. Josef Jaros: Ultrasound Elastography, University of Kuopio, Finland.
4. Andy Milkowski : Elasticity reaching Clinical Maturity, Siemens.
5. Mark L. Palmeri - Kathryn R. Nightingale: Acoustic Radiation Force-Based Elasticity Imaging Methods, Interface Focus (2011).
6. K J Parker, M M Doyley and D J Rubens: Imaging the elastic properties of tissue: the 20 year perspective, Phys. Med. Biol. 56 (2011).
7. Peter NT Wells, Hai Dong Liang: Medical Ultrasonic: Imaging of Soft Tissue Strain and Elasticity, J.R.Soc. Interface 16 June 2011.
8. Jeong Yeon Cho: Clinical values & feasibility of ARFI elastography in  assessment of transplanted kidney , Department of Radiology, Seoul National University Hospital
9.   K.F. Stock, B.S. Klein, M.T. Vo Cong, C. Regenbogen, S. Kemmner, M. Büttner, S. Wagenpfeil, E. Matevossian, L. Renders, U. Heemann, C. Küchle, ARFI-based tissue elasticity quantification and kidney graft dysfunction: First clinical experiences, Clinical Hemorheology and Microcirculation, Volume 49, Number 1-4 / 2011.
10. Brian S. Garra, Ultrasound Elasticity Imaging,  © Applied Radiology,4-2011

Thứ Bảy, 29 tháng 12, 2012

Carotid Artery Stiffness Using Ultrasound Radiofrequency Data Technology


Evaluation of Carotid Artery Stiffness in Obese Children Using Ultrasound Radiofrequency Data Technology

Ye Jin,  Yaqing Chen, Qingya Tang, Mingbo Xue, Wenying Li, and Jun Jiang


Abstract

Objectives—The goals of this study were to investigate the difference in carotid arterial stiffness in obese children compared to healthy children and to study the correlation between carotid arterial stiffness parameters and obesity using ultrasound (US) radiofrequency (RF) data technology.

Methods—Carotid artery stiffness parameters, including the compliance coefficient, stiffness index, and pulse wave velocity, were evaluated in 71 obese patients and 47 healthy controls with US RF data technology. In addition, all participants were evaluated for fat thickness in the paraumbilical abdominal wall and fatty liver using abdominal US.

Results—Compared to the control group, the blood pressure (BP), body mass index (BMI), fat thickness in the paraumbilical abdominal wall, presence of fatty liver, and carotid stiffness parameters (stiffness index and pulse wave velocity) were significantly higher in the obese group, whereas the compliance coefficient was significantly lower in the obese group. Furthermore, the pulse wave velocity was weakly positively correlated with the BMI, systolic BP, diastolic BP, and paraumbilical abdominal wall fat thickness, whereas the compliance coefficient was weakly negatively correlated with the systolic BP, BMI, and paraumbilical abdominal wall fat thickness. The presence of a fatty liver was moderately positively correlated with the BMI and weakly positively correlated with the pulse wave velocity.

Conclusions—Ultrasound RF data technology may be a sensitive noninvasive method that can be used to accurately and quantitatively detect the difference in carotid artery stiffness in obese children compared to healthy children. The detection of carotid functional abnormalities and nonalcoholic fatty liver disease in obese children should allow early therapeutic intervention, which may prevent or delay the development of atherosclerosis in adulthood.

 ___________________________

Ultrasound Examinations of the Common Carotid Artery

With the participants in the supine position, the bilateral carotid arteries were scanned from the top to down in the long axis. For longitudinal 2-dimensional US images of the carotid artery, the near and far arterial walls were displayed as two echogenic lines, and the adventitia and intima were separated by the hypoechoic media. The inner most layer (intima) was isoechoic, continuous, and linear. The far arterial wall appeared as a hyperechoic structure. Carotid artery stiffness was measured at the common carotid artery bifurcation level in the long-axis view. The examination site was selected 1.0 cm below the carotid sinus edge. The width of the probe objective frame was set at 1.4 to 1.5 cm.

The position and height of the probe frame were adjusted to adapt the carotid artery to the middle of the frame. The probe beam direction was adjusted to ensure that the sound beam was vertical to the anterior and posterior arterial walls to clearly show the intima and media in the anterior and posterior walls. During the examinations, the participants were asked to hold their breath just before the start of the RF data scan. This scan detects the distension wave, intended as the change in the diameter of the vessel during a cardiac cycle. The difference between the systolic and diastolic diameter values is hereby the distension, and it is the fundamental parameter measured by the quality arterial stiffness software. The wall-tracking feature was active during the scan (Figure 1; see the orange lines across the vessel wall and the green lines associated with wall distension on pulsing). The real distension represented by the green line movements was “amplified,” giving a fast estimation for the user regarding the vessel’s elastic properties and allowing adequate detection (green lines should be as continuous as possible). The distension waveform represented by the movement of the blue lines was displayed at the bottom of the image. The waveform height provided relative information on the shape to ensure that the scan was continuous without artifacts. The premium elaboration capabilities of the MyLab Gold platform allows very fast frame rate acquisition (≈480 Hz), which allows detection without any ambiguity for wall velocities up to 30 m/s (well above the normal 10 m/s). When the instrument displayed6 continuous and stable values (an SD of the measurement ≤20 μm), the image was fixed and stored immediately. The distension value (systolic – diastolic) was determined during each cardiac cycle, and the software calculated the average value of 6 cardiac cycles.

After the 3 BP measurements had been taken, the average of both systolic and diastolic BPs were calculated and entered manually into the quality arterial stiffness vascular calculation software. The average distension value and the brachial systolic and diastolic BPs were used by the software to generate the carotid stiffness parameters, assuming that the arterial pressure at the level of the brachial artery was the same as that at the level of the carotid artery.


The carotid stiffness parameters were presented in the worksheet report (Figure 2). The mean of 3 measurements along with the maximum value were included in the final report.


Thứ Sáu, 28 tháng 12, 2012

3D US for Uterine Anomalies: The Z Technique


We have reported on standardization of the display of the midcoronal plane of the uterus in 3D volumes in gynecology; this technique, termed the Z technique, should help reduce operator dependency and enhance the diagnostic accuracy of 3D sonography in everyday uses. Details of the Z technique are as follows:

Step 1. Place the reference/rotational point at the midlevel of the endometrial stripe in the sagittal plane (Figure 2).

Step 2. Use Z rotation to align the long axis of the endometrial stripe along the horizontal axis in the sagittal plane of the uterus (Figure 3).
 

Step 3. Place the reference/rotational point at the midlevel of the endometrial stripe in the transverse plane (Figure 4).


Step 4. Use Z rotation to align the endometrial stripe with the horizontal axis in the transverse plane of the uterus (Figure 5).

Step 5. After step 4, the midcoronal plane of the uterus will be displayed in plane C (Figure 5); apply the Z rotation on plane C to display the midcoronal plane in the traditional orientation (Figure 6).


Thứ Sáu, 21 tháng 12, 2012

SIÊU ÂM CHẨN ĐOÁN GÃY SƯỜN và SỤN SƯỜN


Abstract


Introduction


Rib fractures are the most common injuries resulting from blunt chest trauma. However, costal cartilage fractures are almost invisible on chest X-rays unless they involve calcified cartilage. The sensitivity of conventional radiography and computed tomography for detecting rib fractures is limited, especially in cases where rib cartilage is involved. Therefore, this study was designed to evaluate the sensitivities of chest wall ultrasonography, clinical findings, and radiography in the detection of costal cartilage fractures.

Materials and methods


A total of 93 patients presenting with a high clinical suspicion of rib or sternal fractures were recruited for radiological workup with posterior–anterior (PA) chest radiographs, oblique rib views, sternal views, computed tomography, and chest ultrasound between April 2008 and May 2010. There were 47 men and 46 women, and the mean age of the patients was 51.8 ± 15.9 years (range 17–78 years). These patients with minor blunt chest trauma showed no evidence of rib fractures on conventional radiography and computed tomography, and no evidence of other major fractures. Chondral rib fractures were detected by using ultrasonography on a 7.5-MHz linear transducer.

Results


Of the total 93 patients, 64 (68.8%) showed chondral rib fractures, whereas 29 (31.2%) did not. The mean number of chondral rib fracture sites detected in 64 patients was 1.8 ± 0.8 (range 1–5). Subperiosteal hematoma was the most common finding associated with costal cartilage fractures (n = 14, 15.0%), followed by sternal fracture (n = 9, 9.7%). However, subperiosteal hematoma was also noticed in 1 (1.1%) of the patients without costal cartilage fractures, and sternal fractures in 7 patients (7.5%).

Discussion


The results of this study suggest that ultrasonography may be a useful imaging method for detecting costal cartilage fractures overlooked on conventional radiographs and computed tomography in patients with minor blunt chest trauma. Early ultrasonographic evaluation can give more accurate information than clinical and radiologic evaluation in detecting costal cartilage fractures and sternal fractures that are overlooked on conventional radiography and computed tomography after minor blunt chest trauma.

_________________________________________________________________________________

Ultrasound in revelation of chondral rib fracture and  bony rib fracture at an outpatient clinic : A Vietnamese experience

Le Thanh Liem, Nguyen Thien Hung, Le van Tai, Lu Minh Tan, Le Tu Phuc, Phan Thanh Hai

MEDIC MEDICAL CENTER, HCMC, Vietnam

Abstract:

OBJECTIVE:


To disclose chondral or bony rib fracture by ultrasound which are negative on X-ray film of minor blunt chest trauma patients.

METHODS:


A total of 42 patients suffering from minor blunt chest trauma without evidence of a rib fracture on chest X-ray film, were examined with a 9L4 MHz or 7.5 MHz linear transducer of ultrasound system (Siemens, Aloka). Statistical analysis was done to outline the ultrasound findings of these rib fractures.

RESULTS:


There were 50 (100.0%) patients showed chondral and bony rib lesions, whereas these 50 patients had no evidence of rib lesions on X-ray film. Fracture of the rib with a disruption of continuity of bony cortex near junction of chrondral and bony rib was the most common finding in 45 (90,0%) patients. Chondral rib fractures were in five (10,0% )patients. Chondral rib fracture appeared as disruption of cortex, small echogenic lines in chondral rib, and bruised chondral rib was a small deformation of chondral cortex and echogenic area at trauma site which was painful site. Bony rib fractures significantly occurred in trauma patients, and the duration of pain in patients with chondral rib fractures was significantly longer than that of patients with bony rib fractures.


CONCLUSIONS:


Ultrasonography is a useful imaging method in disclosing the rib fractures (chondral and bony rib fractures) which were negative on chest X-ray film in minor blunt chest trauma. However, chondral rib fractures significantly occur less than bony rib fractures and result in a longer duration of pain.


Chondral rib fracture by ox kicking for 4 days.


2 cases of bruised chondral rib by hitting with echogenic line.


A case of calcified chondral rib for 4 years by beating.


A bruised of chondral rib with echogenic area in costal cartilage (below image), but ARFI velocity value in out of  range (above image).


__________________________________

Tại MEDIC, trong 6 tháng cuối năm 2012, có 5 ca gãy dập sụn sườn trong số 50 ca chấn thương nhẹ lồng ngực với gãy xương sườn (và thân xương ức). Ca gãy sụn sườn gần với lúc khám siêu âm là 4 ngày do bị bò đá, ca xa nhất, 4 năm. X-quang không thấy tổn thương ở 2 ca này và các ca còn lại (45 ca). Gãy xương sườn là tổn thương không liên tục của vỏ xương, thường gần chỗ nối sụn và xương, và có kèm theo máu tụ khu trú thành ngực quanh ổ gãy. Gãy sụn sườn ít gặp hơn với  đường viền sụn gián đoạn, hay các đường echo dày trong sụn sườn, trong khi dập sụn sườn có các vùng echo dày trong sụn và bao sụn biến dạng lỏm ở nơi va chạm.


Siêu âm phần mềm thành ngực là phương tiện khám có hiệu quả và phát hiện sớm các trường hợp gãy sụn sườn, xương sườn (và xương ức), góp phần chẩn đoán đầy đủ các trường hợp chấn thương ngực kín nghi có tổn thương xương và sụn sườn, mà các phương tiện khác như X-quang và CT có thể bỏ sót.

Thứ Bảy, 15 tháng 12, 2012

SIÊU ÂM TĨNH MẠCH CHỦ DƯỚI trong SỐC


Sonography has traditionally been used to assess anatomic abnormalities. However, its value in evaluating physiologic characteristics has recently been recognized, particularly in the care of patients in shock. As the use of point-of-care sonography grows in critical care and emergency medicine, noninvasive assessment of intravascular volume status is increasingly being used to guide therapy of the critically ill.

Although intravenous fluid is often the initial treatment in hypotensive patients, aggressive volume resuscitation may be detrimental in some patients and in certain types of shock. Accurate diagnosis of shock state can be challenging because physical findings of hypovolemic, distributive, cardiogenic, and obstructive shock often overlap. Pulmonary artery and central venous pressure catheters, which provide physiologic data such as cardiac output and right atrial pressure, are time-consuming, invasive, and carry considerable risks. Central venous pressure has long been used to guide fluid management; however, data suggest that in critically ill patients, central venous pressure may not correlate with the effective intravascular volume. Furthermore, invasive hemodynamic monitoring has not been shown to benefit patients.

Given the importance of determining intravascular volume in shock, a rapid bedside sonographic examination can be instrumental in guiding medical management of critically ill patients. Multiple sonographic protocols now exist for the evaluation of shock, dyspnea, and cardiac arrest.  This article will describe the use of sonography of the inferior vena cava (IVC) in the evaluation of patients in shock.


Physiology: IVC Parameters
The IVC is a compliant vessel that distends and collapses with pressure and volume changes. Although the absolute IVC size varies widely among healthy individuals and may not by itself be diagnostic, the maximal IVC diameter has been shown to be lower in patients with hypovolemia.5
A better indicator of intravascular volume is collapsibility of the IVC. As intrathoracic pressure decreases with inspiration, venous blood is pulled from the lower half of the body into the right atrium. This action causes a transient, but normal, decrease in the IVC diameter. With expiration, the IVC diameter increases and returns to its baseline. These changes are known as respirophasic variability. The IVC collapsibility index, also known as the caval index, is defined as the difference between the maximal (expiratory) and minimal (inspiratory) IVC diameters divided by the maximal diameter. The caval index is used in spontaneously breathing patients to estimate right atrial pressure.6,7 In patients with minimal respirophasic collapse, having the patient inspire forcefully, or sniff, will differentiate between patients with poor inspiratory effort and those with elevated right atrial pressure. The sniff method may provide more accurate estimation of volume status; however, measurements taken during normal respiration are reasonably accurate as well.8
Recent guidelines from the American Society of Echocardiography support the general use of IVC size and collapsibility in assessment of volume status.9 Studies have suggested the use of specific parameters for maximal IVC diameter and caval index to predict volume status.6,8 In one of these studies, using 2 cm as the cutoff for the maximal IVC diameter resulted in good sensitivity and specificity for predicting elevated right atrial pressure.8 A caval index greater than 50% suggests a low volume state,6 especially in combination with a small IVC diameter. Conversely, a low caval index with a large IVC diameter suggests a high volume state.
Inferior vena cava size does not predict right atrial pressure in patients receiving mechanical ventilation.10 Mechanical ventilation reverses the hemodynamics of venous return during the respiratory cycle. During positive pressure inspiration, intrathoracic pressure is increased, impeding blood flow from the IVC to the right atrium. During expiration, intrathoracic pressure is lower, and venous return increases. In a patient with normal right atrial pressure, this cyclic venous return produces minimal variation of the IVC size during the respiratory cycle. When a patient is volume depleted, however, the right atrium and IVC become more compliant, and the IVC size increases with positive pressure inspiration. Assessment of the IVC has been used in mechanically ventilated patients to predict whether fluid expansion is expected to increase the stroke volume and cardiac output. The variation of the IVC in positive pressure ventilation, known as the IVC distensibility index, is the difference between the maximum and minimum IVC diameters divided by the minimum diameter. In contrast to IVC collapsibility, which indicates volume status, the distensibility index has been used to assess preload dependence and predict fluid responsiveness such that the absence of respiratory variation suggests that volume expansion is unlikely to be effective.11,12 Fluid responsiveness is an emerging and important concept in critical care that seeks to avoid unnecessary fluid administration, which may expose the patient to risks of volume overload, when a fluid challenge is not expected to improve hemodynamics and organ perfusion.
Anatomy and Scanning Technique
A low-frequency phased array transducer (3.5–5 MHz) is used to evaluate the IVC, which lies in the retroperitoneum to the right of the aorta. It is differentiated by its thinner walls and respiratory flow variation. The IVC passes posterior to the liver and is joined by the hepatic veins before it enters the thoracic cavity and drains into the right atrium. There exists considerable variability in the literature regarding the location at which the IVC diameter should be measured. Most studies agree that the measurement should be distal to the junction with the right atrium and within 3 cm of that point.6,8,1214 Other studies measure the IVC at or near the junction with the hepatic veins.11,1520 A study comparing commonly measured locations found that respiratory variation of the IVC at the junction with the right atrium did not correlate with variation at sites distal to the hepatic veins.21 Guidelines from the American Society of Echocardiography recommend an assessment of the IVC just proximal to the hepatic veins, which lie approximately 0.5 to 3 cm from the right atrium.9
To image the IVC, the probe is placed in the subxiphoid 4-chamber position with the probe marker oriented laterally to identify the right ventricle and right atrium. As the probe is progressively aimed toward the spine, the convergence of the IVC with the right atrium will be seen. The IVC should be followed inferiorly, specifically looking for the confluence of the hepatic veins with the IVC (Figure 1). The IVC can also be evaluated in the long-axis plane. For this view, the probe is turned from a 4-chamber subxiphoid to a 2-chamber subxiphoid orientation, with the probe now in a longitudinal orientation (Figure 2). Although this view allows visualization of the IVC throughout the length of the hepatic segment, the true size of the IVC may be underestimated in the long axis due to a common error known as the cylinder tangent effect. This effect occurs when the ultrasound beam travels through the vessel longitudinally in an off-centered plane. One way to avoid underestimating the size of the IVC is to angle the probe laterally and medially until the greatest dimension is identified.
The diameter of the IVC should be measured perpendicular to the long axis of the IVC at end-expiration and end-inspiration. The finding of a small-diameter IVC with large inspiratory collapse (high caval index) correlates with low volume states. This phenomenon may be observed in hypovolemic and distributive shock states (Figures 3 and 4 and Videos 1 and 2). Conversely, a large IVC with minimal collapse (low caval index) suggests a high volume state such as cardiogenic or obstructive shock (Figures 5 and 6 and Videos 3 and 4). Movement of the diaphragm, especially during forceful inspiration or sniffing, may displace the IVC relative to the probe, making it difficult to obtain comparative measurements at the same location. In the short axis, the probe may need to be angled inferiorly during inspiration to locate the site measured at expiration. In the long axis, displacement of the IVC may require angling inferiorly and/or laterally (to avoid tangential measurement). In either orientation, it is recommended to observe the changes of the IVC through several respiratory cycles.
 
M-mode Doppler sonography of the IVC can be used to graphically document the absolute size and dynamic changes in the caliber of the vessel during the patient's respiratory cycle in both short and long axes (Figures 710). It should be noted, however, that M-mode sonography may introduce inaccurate measurements due to the displacement of the IVC relative to the probe during inspiration. Movement of the IVC out of the plane of the M-mode cursor may appear as vessel collapse on the M-mode tracing. It is therefore recommended that M-mode sonography be used after adequately visualizing IVC variability in the B-mode to avoid inaccurate estimation of vessel size and collapse.
Further studies are needed to define normal IVC parameters such as size, collapsibility, and distensibility (in mechanically ventilated patients). Until then, assessment of IVC collapsibility is useful in the critically ill patient whose caval index approaches the extremes. Additionally, caval sonography can be repeated during resuscitation to evaluate improvement of these parameters.
Evidence
Incorporation of a goal-directed sonographic protocol including assessment of the IVC has been shown to improve the accuracy of physician diagnosis in patients with undifferentiated hypotension.22 In a recent prospective study, point-of-care sonography evaluating cardiac contractility and IVC collapsibility in patients with suspected sepsis was shown to increase physician certainty and alter more than 50% of treatment plans.23 Inadequate dilatation of the IVC after a fluid challenge was more sensitive than blood pressure for identification of hypovolemia in trauma patients.24 Another study in trauma patients showed the value of bedside caval sonography in evaluation of fluid status and resuscitation of critically ill patients.25 A study in acutely dyspneic patients presenting to the emergency department showed that IVC sonography rapidly identifies patients with congestive heart failure and volume overload.26
Rather than relying on a single measurement of the IVC, it may be more useful to follow changes in vessel size and collapsibility over time in response to an intervention. Studies have shown a decrease in the IVC diameter and increased collapsibility after blood loss15 and fluid removal during hemodialysis.27 In hypotensive emergency patients, volume resuscitation was associated with increases in the IVC diameter and less inspiratory collapsibility.14 Just as a single blood pressure measurement is an incomplete representation of the hemodynamic status of a patient, sonography of the IVC should be repeated after interventions or changes in clinical parameters. Monitoring of the IVC diameter during resuscitation is an emerging area of research, and further studies are necessary to determine the exact parameters to interpret IVC size and collapsibility.
Pitfalls
The IVC should be followed to the junction with the right atrium to avoid misidentification with the aorta. Because a single long-axis view may be inaccurate, it is recommended to assess the IVC in both short and long axes. Inferior vena cava determinations should be made at or near the confluence with the hepatic veins. Measurements elsewhere may not reflect intravascular volume.
A dynamic evaluation of the degree of IVC collapse with inspiration may correlate better with the intravascular volume than a single static measurement of the vessel size. Inferior vena cava size does not predict right atrial pressure in patients receiving mechanical ventilation. Care should be taken to maintain adequate visualization of the IVC throughout the respiratory cycle because the probe and IVC may be displaced by diaphragmatic and abdominal wall movements. Overestimation of intravascular volume may occur in conditions that impede flow to the right heart, including valvular abnormalities, pulmonary hypertension, and heart failure.
Interpretation of caval physiology is hindered by conditions that restrict the physiologic variability of the IVC, such as liver cirrhosis and fibrosis,28 masses causing external compression, and elevated intra-abdominal pressure. Interpretation of the physiologic characteristics of the IVC should be done in context with the patient's clinical scenario and adjunctive data.
Conclusions
Determination of shock state in critically ill patients is challenging, but caval sonography may be a substitute for invasive hemodynamic monitoring. Assessment of the physiologic characteristics of the IVC provides a rapid distinction between low and high volume states and offers the clinician a rapid, noninvasive way to guide resuscitation in critically ill patients. In addition to caval sonography, focused echocardiography and lung sonography have been suggested by an increasing number of resuscitation sonography protocols to further evaluate patients in shock.


Thứ Ba, 11 tháng 12, 2012

ARFI for Nonalcoholic Fatty Liver


Abstract

PURPOSE:

To investigate the clinical usefulness of ultrasonography-based acoustic radiation force impulse (ARFI) elastography (ie, ARFI sonoelastography) in patients with a diagnosis of nonalcoholic fatty liver disease (NAFLD) and compare ARFI sonoelastography results with transient sonoelastography and serum fibrosis marker test results.

MATERIALS AND METHODS:

Written informed consent was obtained from all subjects, and the local ethics committee approved the study. Fifty-four patients with a liver biopsy-confirmed diagnosis of NAFLD (mean age, 50.6 years +/- 13.7) were examined. All patients with NAFLD and healthy volunteers underwent ARFI sonoelastography, transient sonoelastography, and serum liver fibrosis marker testing (hyaluronic acids, type IV collagen 7 S domain). Ten healthy volunteers underwent ARFI sonoelastography. ARFI sonoelastography results were compared with liver biopsy findings, the reference standard. ARFI sonoelastography findings were compared with liver biopsy, transient sonoelastography, and serum fibrosis marker test results. Student t testing was used for univariate comparisons; Kruskal-Wallis testing, for assessments involving more than two independent groups; and areas under the receiver operating characteristic curve (A(z)), to assess the sensitivity and specificity of ARFI sonoelastography for detection of stage 3 and stage 4 fibrosis.

RESULTS:

Median velocities in the patients with NAFLD were 1.040 m/sec for those with stage 0 fibrosis, 1.120 m/sec for those with stage 1, 1.130 m/sec for those with stage 2, 1.780 m/sec for those with stage 3, and 2.180 m/sec for those with stage 4. The A(z) for the diagnosis of hepatic fibrosis stages 3 or higher was 0.973 (optimal cutoff value, 1.77 m/sec; sensitivity, 100%; specificity, 91%), while that for the diagnosis of stage 4 fibrosis was 0.976 (optimal cutoff value, 1.90 m/sec; sensitivity, 100%; specificity, 96%). Significant correlations between median velocity measured by using ARFI sonoelastography and the following parameters were observed: liver stiffness measured with transient sonoelastography (r = 0.75, P < .0001), serum level of hyaluronic acid(r = 0.459, P = .0009), and serum level of type IV collagen 7 S domain (r = 0.445, P = .0015).

CONCLUSION:

There is a significant positive correlation between median velocity measured by using ARFI sonoelastography and severity of liver fibrosis in patients with NAFLD. The results of ARFI sonoelastography were similar to those of transient sonoelastography


Discussion

Our study results demonstrate a significant positive correlation between median ARFI sonoelastographic velocity and liver fibrosis severity in patients with NAFLD. NAFLD is now a common cause of chronic liver disease. Its incidence in adults and children is rapidly increasing because of ongoing epidemics of obesity and type 2 diabetes (21,22). Patients with NAFLD can be divided into two categories: those with simple steatosis and those with NASH at liver biopsy. However, liver biopsy is an invasive and expensive procedure and is associated with a relatively high risk of complications (7). The biopsy procedure results in pain in 25% of all patients (23), and the risk of severe complications has been reported to be 3.1 cases per 1000 procedures (24). Moreover, the accuracy of biopsy for assessing the severity of liver fibrosis remains questionable, and intra- and interobserver variations have been observed (8,9,2527). Furthermore, sampling errors are often reported, even in patients with NASH (28). Thus, a rapid and noninvasive method of detecting fibrosis in patients with NAFLD is of major clinical interest.

From an imaging viewpoint, we previously reported that transient sonoelastography can be used to measure fibrosis in patients with NAFLD (10,11). Recently, ARFI sonoelastography has been used to generate internal mechanical excitation noninvasively, and this method has attracted a great deal of attention for its use in the measurement of liver stiffness. Friedrich-Rust et al (29) compared ARFI imaging with both transient sonoelastography and serum fibrosis marker testing for the noninvasive assessment of liver fibrosis in patients with viral hepatitis. They reported that the results of US-based ARFI imaging for noninvasive measurement of liver fibrosis were comparable to those of transient sonoelastography and serum fibrosis marker testing.

To our knowledge, no investigators had previously evaluated the utility of ARFI sonoelastography for the assessment of liver fibrosis specifically in patients with NAFLD. Our results demonstrate that the median velocity measured by using ARFI sonoelastography increases as the fibrotic stage increases in these patients. The results also demonstrate a significant relationship between median ARFI sonoelastographic velocity and transient sonoelastographic liver stiffness measurement. Although we found a positive correlation between median ARFI sonoelastographic velocity and serum levels of liver fibrosis markers, the r values were relatively weak; thus, it is unlikely that this correlation can be used clinically.

The major advantages of transient sonoelastography and ARFI sonoelastography, as compared with liver biopsy, are that these techniques are painless, rapid, and have no associated complications and are, therefore, very easily accepted by patients. Moreover, ARFI sonoelastography can be integrated into a conventional US system by using conventional US probes and therefore can be performed during standard US examinations of the liver, which are routinely performed in patients with chronic liver disease.

We found that the optimal median ARFI velocity for the diagnosis of NASH with severe fibrosis (stages 3 and 4) was 1.77 m/sec. Thus, in the future, patients with median velocities of more than 1.77 m/sec should be closely followed up, because it is likely that they have NASH with severe fibrosis. On the other hand, there is a possibility that the patients with a low median velocity might have simple steatosis. Therefore, in the future, patients with a low median velocity measured by using ARFI might be spared from undergoing liver biopsy.

We also found that the median velocity in patients with simple steatosis was lower than that in healthy volunteers. Possible reasons for this observation include the hypothesis that steatosis makes the liver softer because of fat deposition in the liver parenchyma. Unlike viral hepatitis, NASH has two aspects: steatosis and fibrosis. Therefore, in patients with NAFLD, it may be difficult to distinguish between simple steatosis and NASH with mild fibrosis with use of ARFI sonoelastography, although it can be performed more conveniently than transient sonoelastography.

One limitation of our study was that we calculated our accuracy measurements on the basis of the population being studied; therefore, our results are optimized for this specific population and likely include overestimations of performance. Another limitation was the relatively small number of patients, particularly those with higher grades of liver fibrosis. Because of this, we may not have adequately assessed the biologic variability in the patients with higher grades of fibrosis. Selection bias was another limitation because in this study, we did not examine patients who had any clinical evidence of hepatic decompensation. Furthermore, the liver biopsies were performed up to 12 months before ARFI sonoelastography and transient sonoelastography. There is the possibility that the degrees of steatosis and fibrosis had changed for the period. In this study, the same person performed the ARFI sonoelastographic and transient sonoelastographic examinations; this was an advantage because the two examinations could be performed with the patient in the same position. However, it cannot be denied that knowledge of other examinations could have biased results. At present, we have no choice but to depend on liver biopsy for the diagnosis of NASH.

In conclusion, to our knowledge, this is the first study conducted to investigate the potential clinical usefulness of a US-based ARFI elastography technique as a noninvasive method of assessing liver fibrosis in patients with NAFLD. Further investigation is required to ensure that ARFI sonoelastographic measurements are useful diagnostic markers of NASH.

Advances in Knowledge

*          There is a stepwise increase in the median velocity measured by using acoustic radiation force impulse (ARFI) sonoelastography with increasing histologic severity of hepatic fibrosis in fatty liver disease.

*          The median velocity in patients with simple steatosis is lower than that in healthy volunteers.

*          There is a relationship between median velocity measured by using ARFI sonoelastography and liver stiffness measured by using transient sonoelastography.

Implications for Patient Care

*          ARFI sonoelastography can be performed during standard US examinations of the liver, which are routinely performed in patients with chronic liver disease.

*          ARFI sonoelastography is a rapid and noninvasive method of detecting fibrosis in patients with nonalcoholic fatty liver disease.