


Nhiều báo cáo trong các nghiên cứu khác nhau cho thấy hình ảnh giảm âm của siêu âm CAP và B-mode dường như nhạy hơn CT, nhưng kém chính xác hơn so với các phương pháp dựa trên MR (Bảng 2,3).3. Trong khi đó, ASQ và TSI cho thấy hiệu suất tuyệt vời khi so với MRS hoặc MRI-PDFF làm tiêu chuẩn tham khảo trong từng nghiên cứu tiến cứu đơn lẻ (ASQ, độ nhạy, 86,2% và độ đặc hiệu, 100% cho ≥ 10% [108]; TSI, độ nhạy, 85,7% và độ đặc hiệu , 97,4% đối với ≥ 5% [97]). Tuy nhiên, các nghiên cứu đa trung tâm lớn hơn là cần thiết để xác nhận những phát hiện này.
Siêu âm là phương pháp chẩn đoán đầu tay để đánh
giá tình trạng gan nhiễm mỡ; tuy nhiên, bị hạn chế bởi độ nhạy tương đối thấp và
tính biến thiên đáng kể giữa các intra and inter-observers [27,28]. Trong khi đó, QUS nhìn chung thể hiện sự đồng thuận tốt [21,23,88,99]. Hơn nữa, QUS cung cấp các giá trị liên tục liên quan đến hàm
lượng chất béo trong gan, không như siêu âm thường quy, chỉ có các giá trị phân loại chủ quan; điều này giúp theo dõi
lâu dài và đánh giá đáp ứng điều trị [97]. Trong bối cảnh này, QUS là kỹ thuật giúp sàng lọc và theo dõi điều trị bệnh nhân NAFLD. Ngoài
NAFLD, QUS có khả năng áp dụng cho bất kỳ tình trạng tích
tụ mỡ ở gan có ảnh hưởng đến tiên lượng bệnh nhân. Ví dụ, nhiễm mỡ ≥ 30% trong
ghép gan làm tăng nguy cơ thải ghép sau ghép gan [120]. Ngoài
ra, mức độ nặng của gan nhiễm mỡ có liên quan đến kết quả và tỷ lệ tử vong sau phẫu thuật gan [121]. Do đó, các kỹ thuật QUS là công cụ đánh giá trước phẫu thuật hoặc trước ghép gan không xâm
lấn [về sự hiện diện và mức độ gan nhiễm mỡ]. Các kỹ thuật QUS khác nhau, bao gồm
CAP [19], tạo hình giảm âm/attenuation imaging/ [20,21,22,23], ASQ [24] và tạo hình Nakagami [23],
đã được thương mại hóa với kết quả đầy hứa hẹn để định lượng
gan nhiễm mỡ, mặc dù cần xác nhận thêm và tiêu chuẩn hóa để áp dụng lâm sàng.
Viêm và xơ hóa gan cũng là những đặc điểm mô học quan trọng của NAFLD, có ảnh hưởng đến chiến lược điều trị [122]. Mặc dù siêu âm đàn hồi thoáng qua Fibroscan là kỹ thuật tốt để đánh giá xơ hóa gan [123,124,125], nhưng còn hạn chế do đánh giá mù vì không có siêu âm B-mode dẫn đường. ASQ đã được dùng để đánh giá xơ hóa; tuy nhiên, hiệu suất của nó, như đã đề cập, đang gây tranh cãi [113,114,115,116]. Do đó, cần phải đánh giá không xâm lấn tình trạng viêm hoặc xơ hóa ở bệnh nhân NASH/NAFLD. Gần đây, siêu âm đàn hồi sóng biến dạng và phân tán [dyspersion] sóng biến dạng (độ nhớt) phát hiện tôt xơ hóa [126,127] và viêm [128,129]. Những kỹ thuật này, kết hợp với kỹ thuật QUS để định lượng mỡ gan, giúp đánh giá toàn diện bệnh nhân NASH/NAFLD bằng siêu âm.
Cần thiết có các nghiên cứu sâu hơn xác nhận các dấu ấn sinh học dựa trên hình ảnh
này trong mẫu nghiên cứu lớn độc lập.
Conventional Imaging Techniques for Liver Fat Quantification
B-Mode
Ultrasound
B-mode ultrasound is the most common imaging modality used to
evaluate hepatic steatosis. Using B-mode ultrasound, hepatic steatosis can be
graded based on the following findings: 1) higher echogenicity of the liver
than that of the renal cortex, 2) impaired visualization of the intrahepatic
vessels, and 3) impaired visualization of the diaphragm and posterior right
hepatic lobe due to ultrasound beam attenuation (Fig. 1)
[26]. Although B-mode ultrasound has the
advantages of high accessibility and low cost, especially compared with MRI, it
is limited by its relatively low sensitivity for detecting mild hepatic
steatosis (73.3% for detection of > 0%–5% steatosis) [27] and its substantial intra- and
inter-observer variability (κ = 0.54 and 0.43, respectively) [28].
QUS Techniques
Although conventional B-mode ultrasound is used for a wide range
of medical indications, quantitative information from B-mode ultrasound images
is limited because ultrasound images are highly dependent on machine settings.
However, recent technical developments allow ultrasound scanners not only to
deliver images but also to obtain raw radiofrequency (RF) data, which enables
the development of QUS [47]. QUS measures various acoustic parameters,
including the attenuation coefficient (AC) [48], backscatter coefficient (BSC), speckle
statistics [49,50], speed of sound [51,52], and elastography metrics [53,54] from the tissue, most of which are obtained from
the raw RF data rather than processed images [47]. It aims to estimate tissue properties from these
acoustic parameters by using appropriate models and theories of how ultrasound
interacts with the tissue [47]. Since QUS can provide quantitative data related
to tissue properties, it has been studied and utilized in various medical
fields [49] such as the assessment of osteoporosis [55], characterization of the myocardium [56], characterization of breast and thyroid lesions [57,58,59], detection of prostate cancer and metastatic
lymph nodes [60,61], and assessment of tumor response to chemotherapy
[62,63], among others. In addition, QUS is expected to be
effective in detecting hepatic steatosis, because the acoustic properties of
hepatic tissue change with hepatic fat accumulation. Accordingly, multiple QUS
techniques based on various acoustic parameters have been developed to
quantitatively evaluate hepatic steatosis [64]. In this article, we introduce several
representative QUS techniques based on AC, BSC, and speckle statistics for the
evaluation of hepatic steatosis, which are briefly summarized in Table 1 and Figure 3.
Attenuation
Coefficient (AC)
Attenuation refers to the energy loss when an ultrasound wave
passes through tissue, and it is dependent on the tissue properties and the
ultrasound frequency [64]. Ultrasound attenuation increases with hepatic
fat infiltration, which obscures the hepatic vessels and diaphragm during
conventional ultrasound [65,66,67]. AC is a quantitative measure of energy loss
during ultrasound transmission [67]. There are two major approaches for the
evaluation of hepatic steatosis using AC: 1) controlled attenuation parameter
(CAP) obtained with the transient elastography device, using A-mode ultrasound
and 2) B-mode ultrasound-guided attenuation imaging.
Controlled Attenuation Parameter
(CAP)
CAP is one of the most widely studied QUS techniques for the
quantification of hepatic steatosis, which uses an ultrasound-based
vibration-controlled transient elastography (VCTE™) device (Fibroscan,
Echosens). CAP is assessed simultaneously with liver stiffness measurement
using raw RF data acquired by FibroScan [19]. To measure CAP, a patient should lie in the
dorsal decubitus position with the right arm in maximum abduction. Then, an
operator should place the appropriate probe on the intercostal space at the
level of the right hepatic lobe [68]. Originally, a 3.5-MHz probe (M probe) was used
to measure CAP, but a probe with a lower central frequency (XL probe, with a
central frequency of 2.5 MHz) can be used with similar diagnostic performance,
which can be useful for obese patients [69,70]. The probe should be placed in a portion of the
liver with a > 6-cm thickness and without large vessels, and the placement
can be assisted by ultrasound time-motion images. After the probe is placed at
the appropriate site, acquisition of CAP and liver stiffness can be initiated
by pressing the probe button [68]. The final CAP result is expressed as dB/m, which
is correlated with the grade of hepatic steatosis [19]. The overall failure rate of CAP measurement
using the M probe was reported to be 7.7%, which was associated with body mass
index (BMI): 1.0% in patients with BMI ≤ 25 kg/m2 and
58.4% in patients with BMI > 40 kg/m2 [71]. The proper use of XL probes and automatic probe
selection tools may reduce the failure rate [72].
The
diagnostic performance of CAP has been variably reported as AUROCs ranging from
0.64 to > 0.90 (Table 2) [19,73,74,75,76,77,78,79,80,81,82,83]. In a meta-analysis of 19 studies involving 2735
patients, good overall diagnostic performance was reported as AUROCs of 0.823,
0.865, and 0.882 for the detection of hepatic steatosis grade ≥ S1, S2, and S3,
respectively [84]. However, previous studies reported the inferiority
of CAP to MRS (AUROC, 0.77 vs. 0.99 for ≥ S1) [34] or MRI-PDFF (AUROC, 0.88, 0.73, and 0.70 vs.
0.98, 0.90, and 0.79 for ≥ S1, S2, and S3, respectively) [85] for the diagnosis of hepatic steatosis.
Nevertheless, CAP is less
time-consuming and allows the simultaneous evaluation of steatosis and fibrosis
[86,87]. It is also likely to be observer-independent
with good interobserver agreement (concordance correlation coefficient, 0.82
between two raters) [88]. However, CAP can be affected by several other
factors, including skin capsular distance [82,89] and probe type (M vs. XL probe) [16,83] and the cutoff value for the diagnosis of
hepatic steatosis is poorly standardized and variable across studies (Table 2,Fig. 4A). In addition, CAP measurement from a sample
volume is obtained blindly without a B-mode ultrasound image; therefore, the
CAP value can be misevaluated due to the inadvertent inclusion of hepatic
vessels, ducts, masses, or uneven steatosis [87].
B-Mode
Ultrasound-Guided Attenuation Imaging
The measurement of AC under B-mode ultrasound guidance
has been studied since the 1980s [65,66,90]. Recently, novel techniques for calculating the
AC under B-mode ultrasound guidance have been commercialized for the evaluation
of hepatic steatosis, including attenuation imaging (ATI; Canon Medical
Systems) [20], ultrasound-guided attenuation parameter (UGAP;
GE Healthcare) [21], attenuation coefficient (ATT; Hitachi) [22], and tissue attenuation imaging (TAI; Samsung
Medison) [23]. Although the detailed evaluation method slightly
differs between vendors, the general process of measurement is as follows: 1)
B-mode ultrasound evaluation of the liver is performed using a convex probe, 2)
the probe is located to visualize the right hepatic lobe through an intercostal
window for AC measurement, 3) the region of interest (ROI) is placed in the
right hepatic lobe at least 2 cm below the liver capsule to avoid reverberation
artifacts during breath-hold while avoiding or automatically excluding large
vessels, and 4) AC value (in dB/cm/MHz) and reliability of the measurement (in R2) are measured. A measurement of R2 ≥ 0.60–0.90 is considered valid,
depending on the vendors, and usually a median or mean value of five valid
measurements is used for the assessment of hepatic steatosis (Fig. 5) [20,21,22,23,91]. The technical failure rate of these techniques,
including ATI and UGAP, seems to be low (0%–4.3%), although there is little
reported data [20,21,91,92,93].
In several recent studies, AC
calculated with these techniques generally showed a good diagnostic performance
for hepatic steatosis, with liver biopsy or MRI-PDFF as reference standards
(AUROC, 0.76–0.98 with different techniques, reference standards, and target
degree of steatosis) [20,21,22,91,92,93,94,95,96,97,98]. In addition, AC has been shown to correlate
well with the degree of steatosis evaluated by histology or MRI-PDFF (r = 0.47–0.78) [20,21,22,91,92,93,94,95,96,97]. The detailed results of the studies on ATI,
UGAP, ATT, and TAI are summarized in Table 3 and Figure 4B.
The advantage of these
techniques over CAP is their use of B-mode ultrasound images. First,
conventional ultrasound evaluation of the liver can be performed simultaneously
with fat quantification. Second, the ROI for calculating AC can be placed while
visualizing the liver, and a more reliable result can be obtained by avoiding
large vessels, ducts, and hepatic masses or cysts [20,21,22]. Studies have shown that ATI and UGAP are
superior to CAP for the prediction of hepatic steatosis [21,91]. In addition, ATI, UGAP, and TAI showed high
intra- and inter-observer reproducibility (intraclass correlation coefficients
[ICCs] for intra-and inter-observer reproducibility, 0.93 and 0.79 for ATI,
0.86 and 0.84 for UGAP, and 0.99 and 0.99 for TAI, respectively) [21,23,99]. However, AC can also theoretically be affected
by fibrosis, although the effect of fibrosis is less pronounced than steatosis [20]. Different results have been reported on the
effects of hepatic fibrosis on AC measured with ATI, UGAP, or TAI [92,93,97,100,101]. Therefore, further studies and standardization
of AC, with consideration of concurrent hepatic fibrosis, are warranted.
Backscatter
Coefficient (BSC)
BSC is a quantitative measure of ultrasound energy reflected
from a tissue during ultrasound examination and is related to the echogenicity
or “brightness” of the tissue in conventional ultrasound. As echogenicity
increases with fatty liver in conventional ultrasound, BSC is also known to
increase with hepatic fat infiltration [66,67]. In some recent studies, BSC correlated well with
the degree of hepatic steatosis evaluated by liver biopsy (r =
0.67) [67] or MRI-PDFF (r = 0.72 and 0.80) [67,102]. BSC has also been reported to have a good
diagnostic performance for hepatic steatosis (AUROC, 0.85 and 0.83 for ≥ S2 and
≥ S3 and 0.95 for MRI-PDFF ≥ 5%) [67,102], with biopsy or MRI-PDFF as reference standards.
However, these studies were in the research stage, which required
post-processing of QUS data using a custom software.
Ultrasound
Envelope Statistic Parametric Imaging (Speckle Statistics)
Ultrasound images contain speckle patterns that appear in a
granular form. Since the speckle pattern is generated by the scattering of
ultrasound signals by microstructures in the tissue, speckle statistics with
the backscatter envelope can describe the scattering characteristics of the
tissue [49,50,87]. The Rayleigh distribution generally describes
the envelope of the backscattered ultrasound signal, which corresponds to the
distribution of the envelope in the case of a high density of random scatterers
without a coherent signal component [103,104]. However, because the distribution of the
scattered ultrasound signals within the actual tissue does not always follow
the Rayleigh distribution, various statistical models have been proposed [103,104,105,106,107]. Acoustic structure quantification (ASQ) and the
Nakagami distribution have been the most widely studied for tissue
characteristics.
Acoustic Structure Quantification
(ASQ)
ASQ (Canon Medical Systems) is a quantification method for liver
tissue characterization that measures the difference between the theoretical
and real envelope distributions [108]. In ASQ, envelopes are used to compute Cm2 by comparing the variance of the
theoretical Rayleigh distribution and the real backscatter envelope
distribution. Using limited envelope signals less than µ + 4σ, where µ and σ
denote the mean and standard deviation of the envelope distribution,
respectively, Cm2 is recalculated as rCm2.
The recalculated rCm2 and the original Cm2 are
compared to derive the focal disturbance ratio (FD ratio) [24,50,109]. In fatty liver, the echogenicity of the hepatic
parenchyma is increased, and the hepatic vessel walls are blurred due to
reflection and scattering of the ultrasound waves, which results in the
homogenization of the signal strength [24]. Therefore, the FD ratio theoretically decreases
in fatty liver [24].
The
process of performing ASQ examination is as follows. First, B-mode ultrasound
evaluation of the liver is performed. Next, ultrasound images in ASQ mode are
acquired from the right intercostal and right subcostal view 3–5 times each.
Display depth and transmit focus are set to 10 cm and 6 cm, respectively. Then,
ROIs that are as large as possible are placed on the liver in the images, while
avoiding large hepatic vessels and artifacts. Finally, the FD ratio is
calculated automatically within the ROI and displayed on the monitor. The mean
FD ratio can be used for analysis of hepatic steatosis [108,110]. The FD ratio measured in the intercostal and
subcostal views did not show a significant difference and showed good agreement
(ICC, 0.90) [108].
In early animal and human studies, the FD ratio measured by ASQ
correlated well with the fat droplet area on biopsy (r = -0.75 to -0.72) [24,111] or MRS (r = -0.90 to -0.87) [108,110,112]. One study also showed good diagnostic
performance of the FD ratio (AUROC, 0.96 for hepatic steatosis ≥ 10%) [108]. However, another clinical study showed a
relatively weak correlation between the FD ratio and MRS (r = -0.43) and fair
diagnostic performance of the FD ratio for the diagnosis of hepatic steatosis,
defined by a CAP value of > 300 dB/m (AUROC, 0.76) [113]. Furthermore, there have also been several
studies on the relationship between FD ratio and fibrosis, although the results
are controversial, which can be a confounding factor when evaluating hepatic
steatosis using ASQ [112,113,114,115,116]. Further studies on both steatosis and fibrosis
are needed.
Nakagami Imaging
The Nakagami distribution is a generalized statistical model for
evaluating the scattering characteristics within a tissue [50,104]. The Nakagami parameter (m) of the distribution
is a shape parameter that depends only on the shape of the envelope
distribution. The Nakagami parameter encompasses most scattering conditions.
For m < 1, the envelope statistics represent a small number of randomly
distributed scatterers. When m = 1, the envelope statistic is a Rayleigh
distribution and represents a large number of randomly distributed scatterers.
When m > 1, the envelope statistics represent a large number of randomly
distributed scatterers with additional periodic scatterers [50,104]. Therefore, the backscattering characteristics
of liver steatosis can be explained by the Nakagami parameter with specific
physical meanings according to the various amounts and spatial arrangement of
scatterers.
Early
animal and human studies revealed a significant positive correlation between
the Nakagami parameter and the lipid concentration of the liver tissue (r =
0.86 and 0.79 for cholesterol and triglyceride, respectively) [117] and the degree of hepatic steatosis assessed by
a conventional ultrasound-based scoring system (r = 0.84) [118].
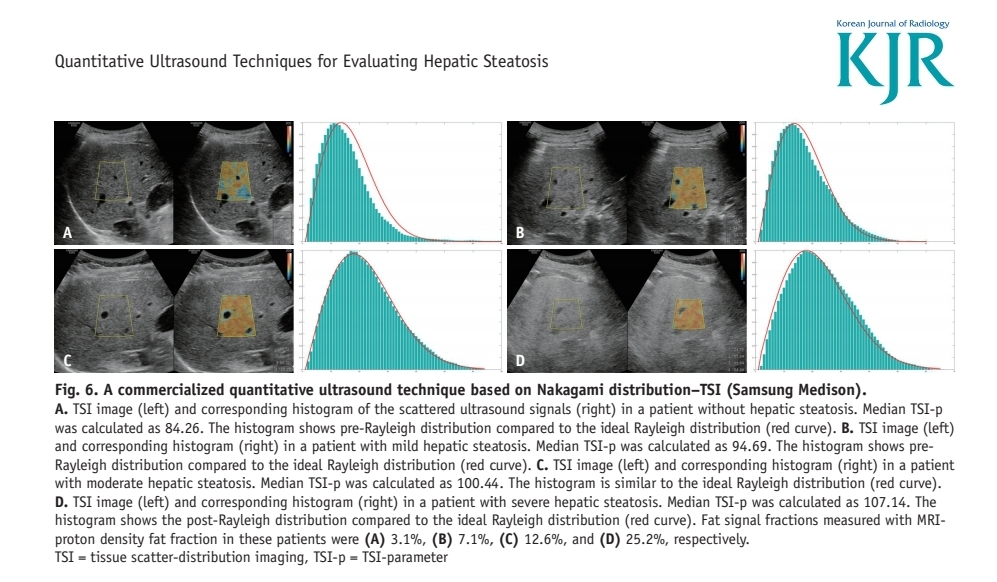
Recently,
a commercially available QUS modality based on the Nakagami distribution,
tissue scatter-distribution imaging (TSI, Samsung Medison), was introduced (Fig. 6) [23,97,101]. The image acquisition process of TSI is similar
to that of TAI. First, B-mode ultrasound images are acquired at the right
hepatic lobe through the intercostal window near the level of the hepatic
hilum. Then, a function key for the TSI is selected and an ROI box is
generated. The operator should place the ROI in a relatively homogeneous region
in the right hepatic lobe, at least 2 cm below the liver capsule. Large hepatic
vessels, focal fat sparing or deposition, and artifacts should be avoided as
for other QUS techniques, including TAI. Finally, the TSI parameter (TSI-p,
which is equal to m × 100) is calculated and the mean or median values of TSI-p
are used for the analysis of hepatic steatosis [23].
In
recent studies, the TSI-p showed a good correlation with both CAP (r =
0.68, with CAP value [23], and r = 0.59 with
steatosis grade determined by CAP [101]) and MRI-PDFF (r = 0.73) [97]. TSI also showed excellent performance for
the diagnosis of hepatic steatosis (AUROC, 0.96 for hepatic fat content ≥ 5%
and 0.94 for hepatic fat content ≥ 10%), with MRI-PDFF as a reference standard
[97] and good intra- and inter-observer agreements
(ICC, 0.98 and 0.95, respectively) [23]. However, there are controversial results
on the effect of TSI-p on fibrosis, which is another important pathological
feature of NAFLD/NASH [97,101]. Therefore, further validation with
consideration of fibrosis is warranted.
Không có nhận xét nào :
Đăng nhận xét