Tổng số lượt xem trang

Thứ Năm, 10 tháng 11, 2022

ULTRASOUND-BASED RADIOMICS


Radiomics là một chuyên ngành khá mới liên quan đến việc trích xuất thông lượng cao các đặc điểm hình ảnh từ các hình ảnh y khoa [1-3]. Chúng được kết hợp với dữ liệu di truyền và lâm sàng, qua sử dụng các phương pháp trí tuệ nhân tạo để trích xuất các đặc điểm của khối u dựa trên sinh lý bệnh, sinh học phân tử và các thông tin liên quan khác, cung cấp các thực hành lâm sàng để hỗ trợ việc ra quyết định điều trị [4,5]. Hiện nay, radiomics có vai trò cần thiết trong chẩn đoán phụ trợ bệnh lý, dự đoán hành vi sinh học của khối u và đánh giá đáp ứng điều trị. Đã có một số nghiên cứu radiomics về chụp cắt lớp vi tính (CT), chụp cộng hưởng từ (MRI) và bệnh học  [6-9]. Là một nhánh quan trọng của hình ảnh y khoa, siêu âm là một phương pháp tạo hình thời gian thực, năng động và thuận tiện, không gây tổn thương bức xạ và phạm vi bao phủ rộng và nhiều chế độ hình ảnh [10]. Radiomics ultrasound là một công nghệ phát triển nhanh chóng với những thách thức và cơ hội đáng kể. Cho đến nay, đã có những nghiên cứu trong nhiều lĩnh vực khác nhau như tuyến giáp [11], vú [12], gan [13], sản khoa [14], tuyến tiền liệt [15] và trực tràng [8]. Với những cập nhật liên tục trong công nghệ xử lý hình ảnh và ứng dụng các thuật toán máy học (ML), radiomics ultrasound có triển vọng ứng dụng rộng rãi. Các đặc điểm radiomics không chỉ tương quan với dữ liệu bộ gen mà còn cung cấp thông tin bổ sung liên quan đến tính không đồng nhất của u trên toàn khối u để tiên lượng  sống còn  và phân tầng nguy cơ. Trong thời đại y học được cá nhân hóa, ultrasound-based radiomics có tiềm năng cải thiện khả năng chẩn đoán, tiên lượng và đánh giá đáp ứng điều trị.

Ứng dụng lâm sàng của US-based radiomics

Trong thực hành lâm sàng, US được sử dụng rộng rãi để phát hiện các bất thường về hình thái các cơ quan (Bảng I). Với sự phát triển của US-based radiomics, nhiều dấu ấn sinh học hình ảnh sẽ xuất hiện thông qua việc trích xuất sâu hơn hình ảnh  không thể nhìn thấy bằng mắt thường, cho phép chẩn đoán bệnh không xâm lấn sớm hơn và chính xác hơn.

Phân biệt lành tính và ác tính

Việc sử dụng phổ biến nhất của US-based radiomics là phân biệt giữa khối u lành tính và ác tính.
Do vị trí nông của tuyến giáp và chất lượng hình ảnh US cao US based radiomics  được áp dụng trước tiên để phân biệt giữa nhân giáp lành tính và ác tính [38-41]. Zhang và cộng sự [11] đã trích xuất các đặc điểm radiomics từ 2064 hình ảnh US đàn hồi và B mode được xác nhận về mặt bệnh lý của các nhân tuyến giáp và thiết lập mô hình chẩn đoán bằng cách sử dụng thuật toán random forest algorithm /rừng ngẫu nhiên/. Khả năng phân biệt nhân giáp lành tính và ác tính của mô hình này tốt hơn so với các bác sĩ hình ảnh có kinh nghiệm. Tương tự, có một số nghiên cứu về US based radiomics để chẩn đoán các khối u lành tính và ác tính ở vú, một số nghiên cứu chỉ trích xuất các đặc điểm US từ hình ảnh B-mode , trong khi những nghiên cứu khác kết hợp giữa hình ảnh B-mode và elastography [42,43]. Các đặc điểm của bệnh ung thư vú triple negative ở US không điển hình. Lee và cộng sự [44] đã phân biệt thành công ung thư vú triple negative với fibroadenoma vú bằng cách sử dụng phân tích  cấu trúc. Hệ thống Dữ liệu và Báo cáo Hình ảnh Vú (BI-RADS) là một phương pháp tiêu chuẩn để đánh giá các nốt ở vú. Tuy nhiên, sự khác biệt đáng kể giữa intra-observer và inter-observer dựa trên BI-RADS đã được báo cáo [45]. Luo và cộng sự [46] đã nghiên cứu 315 trường hợp tổn thương vú nguy cơ cao với BI-RADS 4 hoặc 5 và thiết lập mô hình dự đoán dựa trên radiomics kết hợp với phân loại BI-RADS. Mô hình cho thấy mức độ phân biệt cao giữa lành tính và ác tính (AUC 0,928; CI 95% [0.876, 0.908]). 

B-mode US có khả năng hạn chế trong việc chẩn đoán các bệnh gan khu trú. Trong một nghiên cứu đa trung tâm [47], phân tích radiomics của 2143 tổn thương gan khu trú cho thấy mô hình US based radiomics có độ chính xác và độ đặc hiệu cao khi phân biệt tổn thương gan lành tính và ác tính, và khả năng chẩn đoán cao hơn so với các bác sĩ chuyên môn  kinh nghiệm 15 năm, và độ chính xác chẩn đoán tương đương với CT có contrast. Peng và cộng sự [13] đã sử dụng phương pháp US based radiomics để phân biệt giữa các phân nhóm phụ bệnh lý  của ung thư gan nguyên phát trước phẫu thuật, giúp chẩn đoán và điều trị lâm sàng chính xác. Tương tự, Qin và cộng sự [48] đã phát triển các mô hình US based radiomics để xác định nguồn gốc của các khối u nguyên phát trong bệnh gan di căn, với các giá trị AUC đạt yêu cầu phản ánh trong huấn luyện và test thử nghiệm. Prostate HistoScanning (PHS) là một hệ thống dựa trên máy tính (ML phân loại) được đào tạo để xác định các thay đổi gợi ý đến PCa trong unprocessed 3 D reconstructed US radiofrequency data /dữ liệu tần số vô tuyến siêu âm tái tạo 3D chưa qua xử lý/. Một nghiên cứu gần đây báo cáo rằng những bệnh nhân nghi ngờ PCa có thể được hưởng lợi từ việc bổ sung PHS nhắm mục tiêu sinh thiết có hướng dẫn [49]. Bên cạnh đó, US based radiomics cũng được ứng dụng trong chẩn đoán phân biệt khối u buồng trứng lành tính và ác tính [50], polyp túi mật thật và giả [51] và ung thư nội mạc tử cung [52].


Tổn thương gan lan toả

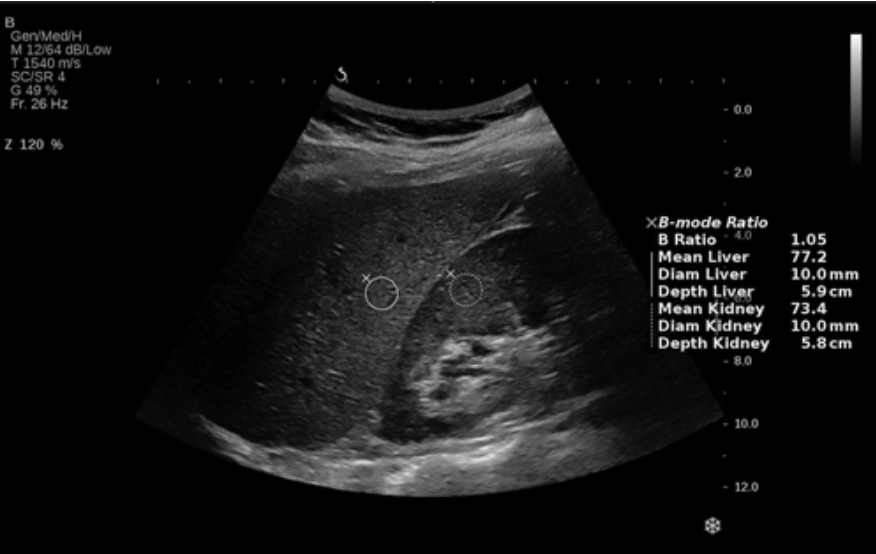
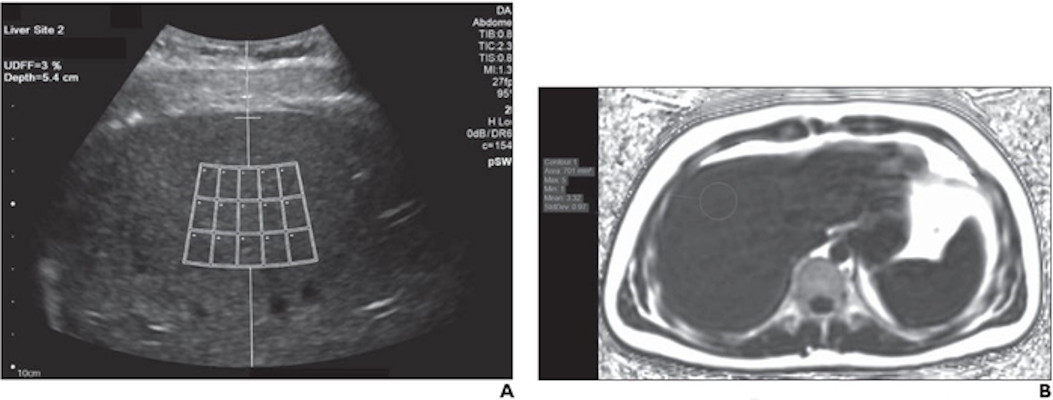
Đánh giá chính xác độ xơ hóa gan là rất quan trọng để ra quyết định điều trị và tiên lượng bệnh [53].
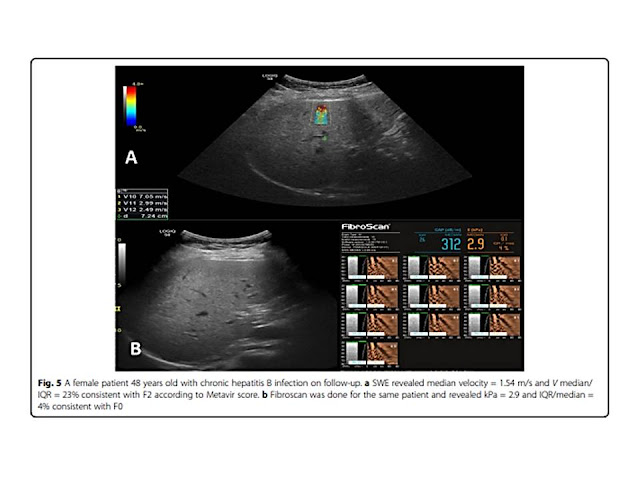
Cho đến nay, sinh thiết gan vẫn là tiêu chuẩn vàng để phân loại xơ hóa gan. Tuy nhiên, sinh thiết là thủ thuật xâm lấn và sai số lấy mẫu có ảnh hưởng đến kết quả. Ngoài ra, sinh thiết gan gây chảy máu, nhiễm trùng và các biến chứng nghiêm trọng khác. Do đó, một số nghiên cứu đã sử dụng US based radiomics để phân loại xơ hóa gan. Các phương thức và thuật toán ML khác nhau của US đã được sử dụng để dự đoán phân loại xơ hóa gan, và tất cả đều có độ chính xác chẩn đoán tốt [37,54-56]. Một nghiên cứu tiền cứu đa trung tâm [57] sử dụng DL trên US đàn hồi sóng biến dạng (SWE) của gan đã báo cáo hiệu quả chẩn đoán cải thiện đáng kể để đánh giá xơ hóa gan trong viêm gan B mạn tính, với khả năng chẩn đoán xơ hóa gan F4 và ≥F3 tiến gần đến mức giải phẫu bệnh lý.
Liu và cộng sự [58] đã sử dụng mạng thần kinh phức hợp để phân tích các đặc điểm hình ảnh radiomics của bao gan và sau đó sử dụng SMV để phân biệt bệnh nhân xơ hóa gan; AUC đạt 0,92.
Tang và cộng sự [59] đã phát triển một mô hình ML dựa trên các thông số định lượng của US bằng cách sử dụng SWE ở chuột và độ chính xác phân loại của bệnh viêm gan nhiễm mỡ được cải thiện đáng kể.

Đánh giá các hành vi sinh học của khối u và cấu hình phân tử

Tiến triển của ung thư đi kèm với những thay đổi sinh lý và sinh hóa phức tạp trong khối u và mô xung quanh. Các đặc điểm hình thái của tổn thương nguyên phát có mối quan hệ nhất định với hành vi sinh học của khối u, chẳng hạn như di căn hạch, độ xâm lấn, mức độ bệnh lý và sự biệt hóa [60]. Tuy nhiên, một số đặc điểm hình thái vi mô này không thể nhìn thấy bằng mắt thường. Các dấu ấn sinh học hình ảnh dự kiến ​​sẽ được trích xuất thông qua phân tích radiomics và hành vi sinh học của những tổn thương này có thể được đánh giá không xâm lấn trước phẫu thuật. Di căn hạch là cơ sở cần thiết cho việc phân giai đoạn di căn hạch (TNM). Xác định di căn hạch trước phẫu thuật  có tầm quan trọng lớn trong việc lựa chọn phương pháp điều trị và tiên lượng bệnh nhân [61].
Một phân tích tổng hợp cho thấy US, CT và MRI không thể đánh giá chính xác tình trạng di căn hạch vì các phương pháp chẩn đoán hình ảnh hiện nay chủ yếu dùng kích thước hạch bạch huyết làm tiêu chí duy nhất cho di căn. Radiomics, mặt khác, cung cấp một giải pháp cho vấn đề này[62]. Chen và cộng sự [63] đã phân tích hồi cứu các đặc điểm radiomics của 115 bệnh nhân ung thư trực tràng và thiết lập một mô hình dự đoán đa tham số và hiệu chuẩn trong dự đoán hạch di căn trong ung thư trực tràng sử dụng US, elastography và hình ảnh CT của các tổn thương nguyên phát, các mô cận ung thư và hạch cực đại. Tương tự, một số nghiên cứu đã tiến hành phân tích hình ảnh radiomics đa phương thức của US cho ung thư biểu mô nhú tuyến giáp (PTC) và đã báo cáo cải thiện đáng kể độ chính xác của dự đoán hạch cổ di căn trong PTC [64-66]. Jin và cộng sự [67] đã phát triển một phương pháp  radiomics không xâm lấn dựa trên kết cấu các tính năng từ hình ảnh US để phát hiện di căn hạch  ở bệnh nhân ung thư cổ tử cung giai đoạn đầu. ML với nhiều phương pháp cũng đã được sử dụng để xây dựng các mô hình khác nhau, chẳng hạn như mô hình xạ hình và mô hình xạ hình-lâm sàng, cho dự đoán di căn hạch nách trong giai đoạn sớm ung thư vú [12,68,69].

Một số nghiên cứu đã chứng minh mối quan hệ chặt chẽ giữa các đặc điểm hình ảnh khối u và di truyền học, có thể cung cấp cơ sở sinh học cho ứng dụng lâm sàng của xạ hình [3]. Gần đây, Kwon et al [70] đã thực hiện một phân tích siêu âm radiomics từ 96 trường hợp PTC được xác nhận bởi bệnh lý; 86 tính năng radiomics đã thu được và một mô hình dự đoán được thành lập, cho thấy hiệu suất vừa phải và dự đoán đột biến BRAF trong PTC. Tuy nhiên, trong một nghiên cứu [71], các đặc điểm radiomics được trích xuất từ ​​527 hình ảnh của US cho thấy giá trị hạn chế như một dấu ấn sinh học không xâm lấn để dự đoán sự hiện diện của đột biến BRAF V600E của PTC không tinh kích thước.

Các đặc điểm radiomics cung cấp các dấu ấn sinh học có giá trị. Có một số phân tích định lượng về hình ảnh của US phản ánh sinh học khối u ở tế bào và mức độ phân tử. Guo và cộng sự [72] đã chứng minh rằng các đặc điểm US radiomics được trích xuất từ ​​hình ảnh ung thư vú có thể phân biệt các khối u có biểu hiện thụ thể estrogen và progesterone khác nhau (AUC = 87,7%). Vi mạch xâm lấn (MVI) [73], được định nghĩa là sự xâm lấn của các tế bào u trong một không gian mạch máu được lót bởi nội mô, đã được chứng minh rộng rãi như một yếu tố dự báo tái phát sớm của ung thư biểu mô tế bào gan (HCC). Hu et al [74] đã trích xuất các đặc trưng của radiomics US của 482 bệnh nhân mắc ung thư biểu mô tế bào gan trên US và thành lập mô hình dự đoán lâm sàng-X quang kết hợp AFP và kích thước khối u, cho thấy một giá trị dự đoán tuyệt vời cho  MVI positivity.

Tương tự, Yao và cộng sự [75] đã thực hiện một phân tích radiomics hình ảnh đa phương thức của US của 177 bệnh nhân tổn thương gan, trích xuất các đặc điểm radiomics và thiết lập năm mô hình ML, cho thấy hiệu suất chẩn đoán và dự đoán tốt để phân biệt lành tính và ác tính và mức độ của các dấu ấn sinh học như như PD-1, Ki-67 và MVI. Ung thư đường mật (ICC) là một bệnh ung thư nguyên phát tích cực có nguồn gốc trong biểu mô ống mật chủ [76]. Không giống như HCC, phẫu thuật cắt bỏ hiện là phương pháp điều trị duy nhất cho bệnh nhân ICC [77]. Một nghiên cứu [78] đã trích xuất các đặc điểm radiomics tiên đoán nhất để đánh giá MVI, xâm nhập perineural, biệt hóa, Ki-67, VEGFR và CK7 trong ICC và báo cáo rằng các tính năng này có hiệu quả vừa phải trong việc dự đoán không xâm lấn  hành vi sinh học của ICC.

Tumor deposits/Khối u lắng đọng (TDs) trong ung thư trực tràng được định nghĩa là các focal clusters/cụm tiêu điểm/ của ung thư biểu mô tuyến nằm ở quanh trực tràng hoặc mỡ quanh trực tràng gần khối u nguyên phát và không kết hợp với khối u nguyên phát hoặc các hạch bạch huyết [79]. TDs có liên quan đến giai đoạn TNM. TD positive có nghĩa là khối u hung hãn hơn và tiên lượng xấu hơn. Rất khó để chẩn đoán xác định TD positive bằng hình ảnh thông thường và chỉ có thể xác định được bệnh lý hậu phẫu. Chen và cộng sự [80] đã phân tích US và độ đàn hồi các đặc điểm hình ảnh của US của 127 bệnh nhân ung thư trực tràng và tiên lượng tiền phẫu của TD-positive.


Ra quyết định điều trị và đánh giá tiên lượng

Cắt bỏ phẫu thuật (SR) và cắt bỏ bằng tần số vô tuyến (RFA) là hai chiến lược điều trị chính để chẩn đoán ung thư biểu mô tế bào gan sớm [81]. Tuy nhiên, sự lựa chọn điều trị cho cá nhân vẫn còn tranh cãi. Liu et al [82] tối ưu hóa việc điều trị HCC sớm dựa trên DL của radiomics trong CEUS, không chỉ dự đoán tỷ lệ sống không tiến triển (progression-free survival, PFS) của bệnh nhân RFA và SR nhưng cũng xác định rằng 17,3% bệnh nhân RFA và 27,3% bệnh nhân SR cần được trao đổi các lựa chọn, có thể làm tăng PFS 2 năm lần lượt là 12% và 15%. Liu và cộng sự [83] đã phát triển và xác thực mô hình radiomics DL dựa trên CEUS (R-DLCEUS), một mô hình ML dựa trên radiomics của đường cong cường độ thời gian CEUS (R-TIC) và ML dựa trên radiomics của hình ảnh thang xám (chế độ R-B) để dự đoán đáp ứng điều trị của bệnh nhân ung thư biểu mô tế bào gan sau khi cá nhân hóa hóa trị liệu động mạch qua gan. Các R-DLCEUS đã báo cáo hiệu quả chẩn đoán cao nhất của 0,93 (KTC 95%, 0,80-0,98) và có thể đạt được hiệu quả dự đoán chính xác và được cá nhân hóa. Tương tự, Ma et al [84] đã phát triển một mô hình kết hợp dựa trên tiền phẫu thuật hình ảnh CEUS động, US thường quy và các yếu tố lâm sàng của tổn thương HCC để dự đoán tái phát sớm và muộn ở bệnh nhân có một tổn thương HCC đơn lẻ có đường kính ≤5 cm sau khi cắt đốt bằng nhiệt, cho thấy hiệu quả tốt (nhóm huấn luyện: AUC 0,89, nhóm thử nghiệm: AUC 0,84). Park và cộng sự [85] đã đánh giá và dự đoán khả năng sống không bệnh của PTC dựa trên các đặc điểm radiomics B-mode US, dự kiến ​​sẽ cung cấp được chẩn đoán và điều trị cá nhân hóa, và giảm đi việc điều trị quá mức ung thư tuyến giáp. Các nghiên cứu về US radiomics hiện tại chủ yếu dựa trên hình ảnh từ một thời điểm duy nhất, trong khi hiệu quả điều trị được dự đoán thông qua phân tích so sánh hình ảnh từ nhiều mốc thời gian trong quá trình điều trị. Một nghiên cứu đa trung tâm cho thấy rằng US radiomics có thể theo dõi đáp ứng điều trị với neoadjuvant chemotherapy/ hóa trị bổ trợ tân sinh/ ở ung thư vú tiến triển tại chỗ.

Tồn tại và cơ hội trong tương lai

Dựa theo điểm đánh giá chất lượng radiomics [87], hình ảnh chất lượng cao, thu thập dữ liệu được chuẩn hóa và xử lý, thêm thông tin từ hình ảnh mới của nhiều thời điểm hơn, nghiên cứu dựa trên cơ sở sinh học phân tử và bệnh học có thể cải thiện chất lượng của các nghiên cứu về radiomics[19].
Các phần tương đối không cố định của US, sự phụ thuộc vào người khám và sự không nhất quán của cài đặt thiết bị và thông số là những lý do chính tại sao sự phát triển của radiomics không theo kịp sự phát triển của các phương pháp chẩn đoán hình ảnh y khoa khác. Ngoài ra, các tính năng của US chỉ có thể được trích xuất từ ​​một phần của tổn thương, vì vậy nó không thể phản ánh toàn bộ khối u, cũng là một hạn chế của việc áp dụng phương pháp US radiomics. Hiện tại, số lượng hình ảnh trong hầu hết các nghiên cứu US radiomics là hàng trăm, vẫn chỉ là số nhỏ khi thực tế là hàng nghìn trường hợp. Hơn nữa, hầu hết  là nghiên cứu đơn độc, điều này làm hạn chế tính tổng quát của các mô hình ML. Phần lớn các nghiên cứu dựa trên US radiomics là hồi cứu.
Thiết kế tương lai có thể cải thiện chất lượng của nghiên cứu nhưng cần khối lượng công việc và thời gian nhiều hơn. Một thách thức khác là khả năng  giải thích giữa các đặc điểm hình ảnh radiomics được trích xuất hiện tại và các đặc điểm lâm sàng.
Với sự cải tiến của công nghệ xử lý hình ảnh, phát triển các phương pháp trí tuệ nhân tạo phù hợp với máy US và liên tục cải tiến độ phân giải của thiết bị, US radiomics đã gia tăng triển vọng. DL đã được chứng minh là cải thiện hiệu suất  đáng kể so với các phương pháp ML truyền thống [88]. TL cũng là một phương pháp hiệu quả để phân loại các cơ sở dữ liệu tương đối nhỏ hiện có. TL đã được đề xuất để có thể áp dụng nhiều hơn trong phân tích hình ảnh US radiomics.
Những thiếu sót của hình ảnh US có thể được bù đắp bằng cách liên tục tăng số lượng hình ảnh và xác nhận bên ngoài để cải thiện hiệu quả chẩn đoán. Bên cạnh đó, để đạt được tính nhất quán của hình ảnh, tiêu chuẩn thu nhận hình ảnh thống nhất [2,89,90], các tham số máy và ROI outline sites /nơi chọn ROI / là cần thiết [19]. Cũng thế, sự phát triển của radiomics dựa trên DL đa phương thức các mô hình (B mode, Doppler, CEUS và đo độ đàn hồi sóng biến dạng) cung cấp thông tin bổ sung có thể nâng cao hiệu quả chẩn đoán [36].Với cải tiến của công nghệ xử lý video động, video động CEUS hoặc siêu âm 3-D  cung cấp nhiều dữ liệu không gian-thời gian và giá trị hơn, lĩnh vực nghiên cứu US radiomics sẽ có bước đột phá trong thời gian tới.


Thứ Sáu, 21 tháng 10, 2022

US can be alternative for biopsy in liver disease patients


By Amerigo Allegretto, AuntMinnie.com staff writer

October 19, 2022 -- Calibrated ultrasound can help with disease staging in hepatic steatosis by detecting liver fat, with results comparable to that of liver biopsy, according to Dutch research published October 18 in Radiology.

A team led by Dr. Gert Weijers from the Radbound Institute for Health Sciences said that the study results show that their calibrated ultrasound method can serve as a noninvasive alternative for liver disease screening and monitoring.

"With the growing epidemic of nonalcoholic fatty liver disease and nonalcoholic steatohepatitis, the need has emerged for an accessible and safe diagnostic measure to screen and observe patients with steatosis," Weijers et al wrote.

Nonalcoholic fatty liver disease is a tricky challenge to pinpoint, which starts with fat accumulation in the liver. Accumulation at 5% or higher being considered steatosis. This disease can progress to nonalcoholic steatohepatitis, which includes inflammation and hepatocyte injury with or without fibrosis and eventual cirrhosis.

Liver biopsy is the standard for staging steatosis, but researchers wrote that this is invasive and can have complications. Although MRI has shown promise in noninvasive screening and monitoring, it's costly and time-consuming, according to the researchers.

The team wanted to look at the diagnostic performance of their calibrated ultrasound protocol for detecting and staging hepatic steatosis. They validated their method against liver biopsy as a reference standard.

The protocol uses conventional 2D ultrasound B-mode images and semiautomatically estimates echo-level and texture parameters. The researchers noted particular interest in the residual attenuation coefficient (RAC), which is the remaining steatosis-driven attenuation gathered after beam profile correction. Data were correlated with patient characteristics, steatosis grades, and fibrosis stages.

"The method is generic, requires only a fixed imaging preset on the ultrasound system, that has been calibrated once, using a tissue-mimicking phantom," Weijers told AuntMinnie.com. "The exported 2D images obtained using this preset can be loaded and analyzed in the calibrated ultrasound software, which runs on a laptop or personal computer."

The study authors put their protocol to the test by examining images collected between 2012 and 2016 from a total of 195 patients, of which 110 were men. Out of the total, 97 patients were placed into a training set while the remaining 98 were placed in a test set. Two observers analyzed the imaging data.


Left) Calibrated ultrasound software shows a normal liver. (Right) Images show nonalcoholic fatty liver disease on an activity score grade-3 liver. Images A and B show original B-mode images with applied lookup table correction. Images C and D are back-scanned images with applied post-processing steps. These steps included automatic gain correction, superficial tissue layer correction, automatic segmentation, and residual attenuation correction. Images courtesy of the RSNA.

The team found that the average calibrated ultrasound interobserver correlation coefficient was 0.95, and that the best correlation with steatosis was found for the RAC parameter (r = 0.78, p < 0.01). However, no correlation was found for fibrosis (r = 0.14, p = 0.054).

Additionally, steatosis detection using RAC showed an area under the receiver operating curve (AUC) of 0.97, with the same going for multivariable AUC. The researchers also noted that the predictive performance for moderate and severe hepatic steatosis using RAC was 0.93 and 0.93, respectively.

They noted a few reasons for the high performance of calibrated ultrasound in the study. For one, this method automatically assesses a large region of the ultrasound image and makes up for the normal depth-dependent behavior of the ultrasound beam and angle dependencies. As a result, it yields depth-independent analysis of quantitative ultrasound parameters.

"Further, automatic segmentation of large blood vessels and the bile duct avoids the impact of vessel wall reflections and blood signals on the calibrated ultrasound parameter," they added.

The group also highlighted that this protocol could enable clinicians to provide feedback on lifestyle changes and may be used as an outcome in clinical trials investigating new therapeutic drugs for nonalcoholic fatty liver disease.

“We also are training and testing convolutional neural networks for steatosis detection in order to enable real-time detection of steatosis on handheld ultrasound devices, to make screening- and follow-up applications accessible and affordable on a large scale,” Weijers added.

Thứ Bảy, 16 tháng 7, 2022

Hepatorenal Index vs Fatty Liver Index in NAFLD and ALD.


Abstract

Objectives

We aimed to evaluate the accuracy of the hepatorenal index by B-mode ratio to diagnose hepatic steatosis, compared to ultrasound steatosis score, controlled attenuation parameter, and the fatty liver index using histology as the gold standard.

Methods

We prospectively included participants with alcohol-related or nonalcoholic fatty liver disease for same-day noninvasive investigations and liver biopsy.

Results

We included 137 participants, 72% male, median age 60 years (53–65) and body mass index 32 kg/m2 (28–38). Eighty percent had steatosis (S0/S1/S2/S3 = 20/37/24/19%). B-mode ratio had moderate diagnostic accuracy for any steatosis (≥S1, area under the receiver operating characteristics curve [AUROC] = 0.79; 95% confidence interval 0.70–0.88), significant steatosis (≥S2, AUROC = 0.76; 0.66–0.85), and severe steatosis (=S3, AUROC = 0.74; 0.62–0.86), independent of disease etiology. The cutoff values to rule-out and rule-in any steatosis were 1.09 and 1.45. While B-mode ratio and controlled attenuation parameter correlated poorly, their diagnostic accuracies were comparable to each other and to ultrasound steatosis scoring. Fatty liver index did not differ from B-mode ratio in detecting any steatosis but had poor accuracy to detect higher steatosis grades. B-mode ratio measurements failed in 12% of patients, compared to 1% for ultrasound steatosis scoring and 2% for controlled attenuation parameter.


Conclusion

The hepatorenal index by B-mode ratio diagnose steatosis with moderate accuracy in patients with alcohol-related or nonalcoholic fatty liver disease, comparable to B-mode ultrasound steatosis scoring and controlled attenuation parameter. However, its clinical use is limited by a high failure rate.

Chủ Nhật, 3 tháng 7, 2022

SWE vs FIBROSCAN in Chronic Hepatitis


Key points

  • Chronic liver disease is one of the commonest chronic diseases worldwide.
  • The degree of fibrosis is important to determine the treatment strategy.
  • SWE and fibroscan are non-invasive tools for liver fibrosis grading.
  • SWE offers almost similar diagnostic accuracy as fibroscan with overestimation tendency.


Abstract

Background

The assessment of liver stiffness and the degree of fibrosis are important factors affecting the management strategy. Multiple non-invasive tools are now available to offer an adequate alternative to biopsy. In this study, we tried to compare the performance of 2D shear wave elastography (SWE) to the transient elastography/fibroscan as a non-invasive tool in the prediction of liver stiffness. This is a prospective study of 215 patients confirmed by serology to have positive virus C or B infection. 2D SWE was done followed by vibration-controlled transient elastography (VCTE) known as fibroscan at the same session. Biopsy results were collected.

Results

The mean age was 51.07 years ± 6.07 SD. Five cases were excluded due to insufficient data. Fibroscan failed in 30 cases out of 210 cases (failure rate of 14.3%) compared with only 12 patients (6.7% failure rate) while using SWE. Only 180 patients completed the study to the result analysis. SWE results showed significant agreement to the fibroscan results with 86.7% agreement with a tendency for overestimation of the degree of fibrosis (11.7%). The efficacy of SWE was the highest during the assessment of patients with F0 (98.9%), F1 (97.8%), and F4 (93.3%) respectively and relatively low in F2 (92.8%) and F3 (90.6%).


Conclusion

2D SWE is a relatively recent non-invasive tool in the assessment of liver fibrosis grading which can be used as an alternative to the fibroscan with almost similar diagnostic performance especially when fibroscan is not capable to obtain adequate results such as in obesity and ascites.

Thứ Sáu, 17 tháng 6, 2022

Imaging shows A-Z COVID vaccine may trigger blood clots


June 15, 2022

MRI, CT, and ultrasound identify blood clots not found on clinical assessment in a majority of individuals who have COVID-19 vaccine-induced low blood platelets after their first dose of the AstraZeneca vaccine, according to a case study published June 14 in Radiology.

The findings could help clinicians better care for patients who have received the AstraZeneca inoculation and have developed what is called vaccine-induced immune thrombotic thrombocytopenia (VITT), wrote a team led by Priya Rogers of Addenbrooke's Hospital in Cambridge, U.K.

"Whole-body imaging can identify patients who require early referral to specialist vascular or hepatobiliary centers [due to VITT]," the group noted.

Images in a 64-year-old woman who presented with confusion and collapse and was diagnosed with intracranial hemorrhage associated with cerebral venous sinus thrombosis secondary to VITT
Images in a 64-year-old woman who presented with confusion and collapse and was diagnosed with intracranial hemorrhage associated with cerebral venous sinus thrombosis secondary to VITT. (A) Axial unenhanced head CT image demonstrates a large right parietal lobe intraparenchymal hemorrhage and (B) bilateral infarcts in the cerebellum confirmed on axial brain T2-weighted MRI. (D) CT pulmonary angiogram coronal reformatted image shows eccentric mural thrombus within the aorta (white arrow) and large central saddle embolus (red asterisks). Images and caption courtesy of the RSNA.

Experts recommend symptom-specific imaging for VITT, but its prevalence remains unclear, Rogers and colleagues noted. To clarify the question, the group conducted a study that included 40 patients who developed thrombocytopenia after receiving their first dose of the AstraZeneca vaccine. The patients were imaged with CT, ultrasound, and/or MRI depending on protocol in seven different centers across the U.K.

Of these 40 patients, 80% developed thrombosis symptoms within 14 days and 20% within 14 to 28 days. The investigators also found the following:

  • 75% of patients underwent additional imaging, primarily with CT pulmonary angiogram or CT of the abdomen or pelvis.
  • 83% of those patients who had additional imaging were found to have hidden blood clots.
  • 73% of the patient cohort presented with neurological symptoms (headache, blurred vision, seizure, collapse) and were confirmed by CT or MR venogram to have a cerebral venous sinus blood clot.
  • 30% had extension of their primary blood clot.
  • 20% of the total cohort died (eight of 40); those with confirmed progressive thrombosis (four patients) had a mortality rate of 50%.

Most patients underwent some form of CT imaging, the authors noted.

Imaging modality within 48 hours of admission for symptoms of blood clotting
Total patientsMRI abdomen with contrastUltrasound duplex abdomenUltrasound duplex peripheral veinsCT abdomen/pelvis with contrastCT pulmonary angiogramCT chest abdomen/pelvis with contrast/CT aortogramCT head and CT/MRI venogram
401119151539

Imaging can play a key role in identifying and dealing with vaccine complications, according to Rogers and colleagues.

"[Our] findings emphasize that VITT is a multisystem disorder and suggest that whole-body contrast-enhanced imaging is likely to identify further thrombosis," they concluded.

Thứ Sáu, 10 tháng 6, 2022

Quantitative US can help detect hepatic steatosis


By Erik L. Ridley, AuntMinnie.com staff writer


June 8, 2022 -- A quantitative ultrasound technique can be highly sensitive for detecting hepatic steatosis, correlating highly with MRI measurements, according to research published June 8 in the American Journal of Roentgenology

In a prospective, cross-sectional study, researchers from Cincinnati Children's Hospital Medical Center found that ultrasound-derived fat projection (UDFF) yielded 94.1% sensitivity for detection of MRI proton-density fat fraction (PDFF) measurements exceeding a commonly used threshold for clinically significant hepatic steatosis.

"These results support a clinical role of UDFF in the detection of hepatic steatosis, with a UDFF > 5% having high sensitivity for detection of MRI PDFF ≥ 5.5%," wrote corresponding author Dr. Andrew Trout and colleagues.

Although increased hepatic echogenicity and associated decreased conspicuity of the portal triads on ultrasound has been utilized to identify hepatic steatosis, the modality has -- unlike MRI -- not traditionally been able to provide true quantification of liver fat. In their study, the researchers sought to evaluate the performance of UDFF, one of several new methods developed by ultrasound vendors for detecting and quantifying hepatic steatosis on ultrasound.

They included 56 overweight and obese adults and adolescents ≥ 16 years in the study. During a single visit between August and October 2020, all participants received investigational liver MRI on a Signa Architect 3-tesla MRI scanner (GE Healthcare), as well as an ultrasound exam with a DAX deep abdominal transducer on an Acuson Sequoia ultrasound scanner (Siemens Healthineers).

UDFF, a clinically available technique developed by Siemens, was measured on all patients. The method is derived from the measurement and combination of both attenuation effect and backscatter. After a median UDFF is calculated across five measurements on all three acquisitions, a final UDFF percentage is then produced based on the median of the three acquisitions, according to the researchers.

ultrasound-derived fat fraction images of a 23-year-old man with body mass index of 25
A 23-year-old man with body mass index of 25.1. (A) For ultrasound-derived fat fraction (UDFF) measurement, the operator places crossbar at liver capsule, with sample region of interest fixed 1.5 cm deep from crossbar, to ensure measurement obtained sufficiently deep to liver capsule. Overall UDFF was 3%. (B) Median MRI proton density fat fraction (PDFF) from three acquisitions was 3%, demonstrating agreement. Images courtesy of the American Roentgen Ray Society and the American Journal of Roentgenology.

In the study, three MRI PDFF acquisitions were also completed using GE's Ideal IQ whole-liver 3D axial confounder-corrected technique. An image analyst then calculated the PDFF measurements under the supervision of a pediatric radiologist with 10 years of post-training experience, according to the researchers.

The UDFF measurements had a positive association with MRI PDFF results, producing a rho of 0.82 and intraclass correlation coefficient of 0.84. The mean bias between UDFF and PDFF was 4%.

Overall, UDFF had an area under the curve of 0.9 for diagnosing MRI PDFF ≥ 5.5 -- the threshold considered to represent clinically significant hepatic steatosis. A UDFF overall cutoff of > 5% produced 94.1% sensitivity and 63.6% specificity for diagnosing MRI PDFF ≥ 5.5.

The researchers noted that liver UDFF is expressed as a percentage, analogous to MRI PDFF.

"Thus, not only is diagnostic performance for a specific threshold fat fraction clinically relevant, but the correspondence in measured fat fraction percentage between techniques is also relevant, particularly if the techniques are used to monitor for change in fat fraction over time or in response to therapy," they wrote.

Furthermore, the area under the receiver operating characteristic curve for UDFF did not differ significantly based on the number of measurements. As a result, the researchers concluded that three measurements are likely sufficient for determining UDFF in clinical practice, according to the researchers.

"Use of three UDFF measurements is anticipated to achieve similar results as obtained from a greater number of measurements while improving examination efficiency; we do not advise use of a single measurement given the possibility of obtaining a single erroneous value," they wrote.

Thứ Sáu, 15 tháng 4, 2022

Deep Learning Prediction of Ovarian Malignancy at US Compared with O-RADS and Expert Assessment


* H.C. and B.W.Y. contributed equally to this work.

Published Online:

A deep learning model that used feature fusion to classify benign and malignant ovarian tumors on gray scale and color Doppler US images achieved a similar performance to clinical expert assessment.

Background

Deep learning (DL) algorithms could improve the classification of ovarian tumors assessed with multimodal US.

Purpose

To develop DL algorithms for the automated classification of benign versus malignant ovarian tumors assessed with US and to compare algorithm performance to Ovarian-Adnexal Reporting and Data System (O-RADS) and subjective expert assessment for malignancy.

Materials and Methods

This retrospective study included consecutive women with ovarian tumors undergoing gray scale and color Doppler US from January 2019 to November 2019. Histopathologic analysis was the reference standard. The data set was divided into training (70%), validation (10%), and test (20%) sets. Algorithms modified from residual network (ResNet) with two fusion strategies (feature fusion [hereafter, DLfeature] or decision fusion [hereafter, DLdecision]) were developed. DL prediction of malignancy was compared with O-RADS risk categorization and expert assessment by area under the receiver operating characteristic curve (AUC) analysis in the test set.

Results

A total of 422 women (mean age, 46.4 years ± 14.8 [SD]) with 304 benign and 118 malignant tumors were included; there were 337 women in the training and validation data set and 85 women in the test data set. DLfeature had an AUC of 0.93 (95% CI: 0.85, 0.97) for classifying malignant from benign ovarian tumors, comparable with O-RADS (AUC, 0.92; 95% CI: 0.85, 0.97; P = .88) and expert assessment (AUC, 0.97; 95% CI: 0.91, 0.99; P = .07), and similar to DLdecision (AUC, 0.90; 95% CI: 0.82, 0.96; P = .29). DLdecision, DLfeature, O-RADS, and expert assessment achieved sensitivities of 92%, 92%, 92%, and 96%, respectively, and specificities of 80%, 85%, 89%, and 87%, respectively, for malignancy.


Conclusion

Deep learning algorithms developed by using multimodal US images may distinguish malignant from benign ovarian tumors with diagnostic performance comparable to expert subjective and Ovarian-Adnexal Reporting and Data System assessment.

© RSNA, 2022

U S offers alternative to MRI for bone stress


By Kate Madden Yee, AuntMinnie.com staff writer

March 24, 2022 -- Ultrasound appears to be an effective point-of-care alternative to MRI for the evaluation of bone stress injury, according to a study published March 22 in the Journal of Ultrasound in Medicine.

MRI is typically used to assess bone injuries, but the study results suggest that clinicians may have a more easily accessible tool for this application, wrote a team led by Dr. Isaac Syrop of Columbia University in New York City and Dr. Yaeko Fukushima, PhD, of Kansai Medical University in Osaka, Japan.

"There are many advantages to ultrasound imaging over MRI, including its dynamic practicality, which provides the treating clinician with an opportunity to evaluate local soft tissue sites in real-time," the group wrote. "Ultrasound imaging takes significantly less time than MRI to perform ... and can be done as part of the clinical evaluation."

Bone stress injuries are common in young adult athletes, and can negatively affect performance over the long term, the investigators noted. It's crucial to diagnose these injuries early so that athletes can be treated effectively and return to play.

X-ray and CT aren't very effective for early diagnosis of bone stress injuries and expose patients to radiation; since the 1980s, MRI has been used as the diagnostic standard. But MRI is expensive and time-consuming.

"There is good reason to believe that the more affordable and accessible diagnostic option of musculoskeletal ultrasound imaging may help to address the shortcomings of MRI," the authors noted.

The researchers sought to compare the sensitivity and specificity of ultrasound to MRI in the diagnosis of bone stress injury through a study that included 37 young adult athletes presenting in an academic sports medicine clinic between 2016 and 2020 with suspected lower extremity bone stress injury. Sports included everything from crew, field hockey, gymnastics, and running to soccer, tennis, track, and volleyball. All patients underwent MRI and ultrasound exams.

Of the 37 study participants, 30 (81%) had bone stress injuries. The most common injuries were in the metatarsal bones (54%) and the tibia (32%).

Ultrasound scored relatively high across a range of performance measures relative to the gold standard of diagnosis on MRI scans, the group found.

Performance of ultrasound for diagnosing bone stress injuries compared with baseline assessment MRI
MeasurePerformance
Sensitivity80%
Specificity71%
Positive predictive value92%
Negative predictive value45%

"In summary, ultrasound imaging may be a point-of-care tool for the current practicing sports medicine provider to combine with their clinical evaluation in the diagnosis of bone stress injuries of the lower extremity," the team concluded.

Thứ Sáu, 18 tháng 3, 2022

5 rules for diagnosing fetal problems on ultrasound

 By Amerigo Allegretto, AuntMinnie.com staff writer


March 16, 2022 -- So, you perform a fetal ultrasound scan and find something that might indicate an ectopic pregnancy. But how can you be sure? A presentation at the 2022 American Institute of Ultrasound in Medicine (AIUM) annual meeting gave the answer.

In his talk, Dr. Peter Doubilet, PhD, from Brigham and Women's Hospital in Boston listed five rules for ultrasonographers and clinicians to consider when diagnosing fetal problems in the first trimester when women present with abnormal vaginal bleeding, which in turn influences treatment decisions.

"The key principle for ultrasound in early pregnancy loss is to virtually eliminate false positives," Doubilet said.

Peter Doubilet talked about ultrasound
Dr. Peter Doubilet, PhD, talked about ultrasound's use in determining whether a pregnancy is ectopic, as well as the consequences of false-positive and false-negative readings.

Ultrasound is used for patients who present with positive symptoms of pregnancy, with the gestational sac typically being the first object seen about five weeks into a pregnancy. However, abnormal vaginal bleeding is a sign of early pregnancy loss or ectopic pregnancy. Doubilet said that about 25% of early, clinically recognized pregnancies end in miscarriage.

"And those are only the clinically recognized ones, and then there are others that aren't recognized that end in miscarriage," he said.

However, false-positive and false-negative results have consequences, with Doubilet saying that the former is "way more consequential." This is because treatments following false-positive readings for ectopic pregnancies, such as methotrexate, can inadvertently cause miscarriages, stillbirths, or birth defects for healthy embryos.

Doubilet's five rules to consider for fetal ultrasound include the following:

  1. If a mass is extraovarian, it's "almost certainly" an ectopic pregnancy. If the mass is inside the ovary, it's a corpus luteum.
  2. If you're unsure about masses in or beside the ovary, press with a transvaginal transducer. If the mass moves with the ovary, it's most likely a corpus luteum. If it moves separately from the ovary, it's an ectopic pregnancy.
  3. A gestational sac located in the cervix is likely a cervical ectopic pregnancy, especially if it's well-formed and has a fetal heartbeat. It is likely also a miscarriage in progress if it is a flattened sac without a heartbeat. If you can't tell and the patient is stable, leave the scan for one or two days. The ectopic pregnancy will still be there while the miscarriage in progress will have passed.
  4. If you have an eccentric gestational sac in the uterus, it's likely to be an interstitial ectopic pregnancy. This also applies if it bulges the uterine contour and has no visible surrounding myometrium. If you're unsure, 3D ultrasound can help provide the correct diagnosis.
  5. If you see a gestational sac in the uterus on ultrasound, a separate adnexal mass is likely to be a tubal ectopic, heterotopic pregnancy. This also applies if it has a heartbeat or a yolk sac in the adnexal mass in addition to the intrauterine pregnancy. The mass is likely to be a corpus luteum if there is no heartbeat or yolk sac. Heterotopic pregnancies are "very rare" while corpus luteums are common.