Practice of Ultrasound: Part 13 -- Liver fat and fibrosis
By Dr. Jason Birnholz, AuntMinnie.com contributing writer
Siêu âm gan gần như trở
thành thiết yếu của mọi cuộc khám siêu âm bụng trên bệnh nhân từ trước dậy thì
cho đến người già, khi có dịch béo phì.
Thâm nhiễm mỡ (thấm mỡ) là nguyên nhân phổ biến nhất gây viêm gan
dẫn đến xơ hóa, có thể tiến triển thành xơ gan lâm sàng. Nhận biết gan thấm mỡ
và xơ hóa gan là nhiệm vụ chính yếu của siêu âm thang độ xám.
Khám gan thấm mỡ phụ thuộc vào cài đặt máy, đó là lý do tại sao từ những
năm 1980, chậm có tiến bộ kỹ thuật cho
tới không tồn tại trong lĩnh vực này, và giải thích vì sao, gần đây cộng đồng
siêu âm quan tâm đến các dạng khác nhau
của elastography.
Ý kiến của tôi là đã bỏ lỡ tiềm năng chẩn đoán sớm của siêu âm về
gan thấm mỡ.
Các bài báo khoa học về các dạng MRI khác nhau cho gan thấm mỡ thường
có một số câu cho rằng siêu âm "có thể khám gan thấm mỡ, nhưng không định
lượng được",
MRI, tất nhiên, là một công cụ tuyệt vời, nhưng nó không có khả năng
sàng lọc nhanh, chi phí thấp như siêu âm được sử dụng mỗi ngày.
Gan thấm Mỡ
Gan thấm mỡ khi có sự tích tụ triglycerides trong tế bào chất của
tế bào gan, ban đầu là những túi nhỏ, một số sẽ kết hợp thành những hạt lớn
hơn làm dời chỗ nhân tế bào hoặc biến dạng
tế bào. Tất cả các túi này, nhỏ hơn nhiều so với bước sóng ngắn nhất của đầu dò
siêu âm.
Các phát hiện siêu âm là do những thay đổi trong nonspecular
components [các thành phần không phân tử] của tín hiệu ảnh hưởng đến tán xạ âm.
Dạng điển hình là kích thước gan bình
thường và cấu trúc mạch máu xuất hiện bình thường =gan sáng hoặc "nhờn" [greasy] mà không tăng giảm âm phần sâu [attenuation].
Nhu mô gan thấm mỡ có nhiễu đốm mịn, và tăng nhiễu ồn. Thông
thường siêu âm thận không có vấn đề; gan cũng sáng hơn nhu mô thận. Nếu bạn
không đạt được gain [khuêch đại] tăng quá cao, bạn cũng sẽ nhận thấy
artifact tăng cường ring-down đến tĩnh
mạch gan ở xa.
Khi có một gradient âm trong các đặc tính như trọng lực riêng giữa
máu trong mạch và các tế bào gan thấm mỡ xung quanh nó, mặt cắt ngang của một
mạch hoạt động giống như thấu kính hội tụ, tập trung chùm âm và tăng cường sự
phản xạ. Đó có thể là loại tinh tế, nhưng nếu bạn thấy nó và gan có vẻ bình
thường, bạn nên cho bác sĩ giới thiệu làm thêm một số xét nghiệm (như
triglycerides huyết thanh).
Tại sao xác định gan
nhiễm mỡ là một ý tưởng tốt?
Có một mối liên hệ rõ ràng giữa béo phì và gan nhiễm mỡ. Khi bạn
nhận được một bệnh nhân nặng hơn 300-lb, bạn mong đợi để xem một gan thấm mỡ, nhưng
không phải là luôn như vậy. Đôi khi bạn sẽ bị sốc khi nhìn thấy gan nhiễm mỡ ở
người có chỉ số khối cơ thể (BMI) không cao và không có tiền sử uống rượu quá
mức và kéo dài hoặc các điều kiện khác hoặc phơi nhiễm thuốc.
Suy nghĩ chung là gan nhiễm mỡ là một phần của hội chứng chuyển
hóa, xuất hiện lâm sàng sau một thập kỷ tiếp diễn suy giảm cận lâm sàng hoặc
nhiều hơn. Gan nhiễm mỡ gây ra hoặc thúc đẩy hội chứng chuyển hóa, bởi vì nó
thường là điều đầu tiên mà bạn siêu âm tìm thấy.
Hầu hết bệnh nhân của tôi là phụ nữ với vấn đề phụ khoa, và vì lý
do nào đó, một số người có xét nghiệm labo thông thường bao gồm cholesterol,
chất béo trung tính, hoặc hemoglobin A1c. Ngẫu nhiên, gan nhiễm mỡ thường gặp ở
nam nhiều hơn nữ giới.
Các giai đoạn đầu của gan nhiễm mỡ có thể đảo ngược. Khi tôi có
bệnh nhân mập với phát hiện siêu âm gan nhiễm mỡ, tôi nói với họ tích lũy mỡ
trong gan thuộc nhóm nguy cơ cao tăng huyết áp và tiểu đường và các biến chứng
liên quan đến những bệnh này. Họ thường chấp nhận giảm cân và tập thể dục với
mức độ nghiêm túc hơn so với trước.
Tôi nghi ngờ rằng trong tương lai, một phần của việc quản lý gan
nhiễm mỡ, có hoặc không có các đặc điểm khác của hội chứng chuyển hóa, sẽ bao
gồm điều trị bằng thuốc với một tác nhân như statin để hạn chế viêm, làm giảm triệu
chứng lâm sàng. Gần đây có quan tâm sử dụng curcumin [nghệ] như để phòng ngừa, nhưng có những vấn đề cần
phải được giải quyết về sinh khả dụng và liều lượng.
Một định nghĩa chính xác về gan nhiễm mỡ (như mỡ ở trên 5,5% trọng
lượng gan) là bắt buộc trong y học, nhưng nếu xác định có đủ chất béo trong máu,
thì với việc ra quyết định lâm sàng đủ
để phòng ngừa. Tỷ lệ gan nhiễm mỡ hiện chiếm khoảng 15% dân số nói chung ở
Trung Quốc và 30% ở Mỹ.
Bệnh gan nhiễm mỡ không do rượu đã được dự đoán là căn bệnh số một
trên toàn thế giới trong chưa đầy một thập kỷ. Một tỷ lệ tương đối nhỏ bệnh
nhân gan nhiễm mỡ sẽ tiếp tục hóa xơ và chai gan, nhưng hội chứng chuyển hóa và
các biến chứng của nó là gánh nặng rất lớn cho bất kỳ hệ thống chăm sóc sức
khỏe nào. Siêu âm bụng thường quy bao gồm gan có thể là quà tặng khi gan nhiễm mỡ ở
giai đoạn còn điều trị được.
Bệnh gan lan tỏa, mô hình địa lý, dân tộc và di truyền
Bệnh nhân của tôi gồm bệnh nhân da trắng và gốc Tây Ban Nha (chủ
yếu là người Mexico) với nhóm người Mỹ gốc Phi và châu Á ít hơn, chủ yếu là phụ
nữ và người lớn và không phải trẻ em. Xét về gan nhiễm mỡ, tỷ lệ này cao hơn ở
những bệnh nhân gốc Tây Ban Nha (nữ và nam) cao hơn so với các nhóm dân tộc khác.
Điều này cũng có một số nghiên cứu chặt chẽ quan sát với quần thể bệnh nhân lớn và đặc
tính chính xác của gan nhiễm mỡ.
Gan nhiễm mỡ không hẵn liên quan chế độ ăn kiêng. Nói một cách đơn
giản, khi có sự khác biệt về tỷ lệ mắc bệnh của nhóm chủng tộc thì phải có yếu
tố di truyền (hoặc các yếu tố). Rất nhiều điều phức tạp đã được tìm hiểu về di
truyền của gan nhiễm mỡ trong những năm gần đây. Một phát hiện được xác nhận là
một đa hình nucleotide đơn (SNP) cho gen kiểm soát quá trình oxy hóa các axit
béo, có tỷ lệ cao nhất ở quần thể gốc Tây Ban Nha.
Chúng ta có xu hướng nghĩ đến gan nhiễm mỡ là một trong những bệnh
gan "lan tỏa", ảnh hưởng gan một cách đồng nhất. Khi lần đầu nhìn
thấy một nốt "tròn" trong gan nhiễm mỡ, bạn sẽ cho rằng đây là tổn
thương di căn.
Tôi nhớ có làm một số sinh thiết gan với siêu âm hướng dẫn của các
nốt như vậy vào đầu những năm 1980. Kết quả luôn luôn là "gan bình
thường". Tất nhiên chúng tôi lo ngại rằng có thể bỏ lỡ tổn thương, cho đến
khi chúng tôi biết được rằng đây thực sự là những nốt gan bình thường chưa có
hoặc bằng cách nào đó chống lại sự tích tụ mỡ.
Kể từ những năm 1990 và chủ yếu thông qua CT scanning người ta đã
biết gan nhiễm mỡ có thể có một kiểu hình bản đồ với các vùng mô mỡ và bình
thường.
Điều này trở nên quan trọng khi chúng tôi cố gắng lấy mẫu một phần
nhỏ của gan bằng sinh thiết hoặc một số ứng dụng khu vực quan tâm như
elastography. Chúng ta cần lấy mẫu bao nhiêu lần và thường xuyên như thế nào?
Bạn có thể có thể trả lời điều đó cho bệnh khối u, nhưng nó có thể khó khăn cho
các tình huống tiềm năng gan nhiễm mỡ hoặc xơ hóa từng vùng.
Hoạt động của Nang mỡ
Tôi không có ý định nói nhiều về giai đoạn thứ phát của thoái hóa gan, đó là tình trạng viêm. Viêm per se [tự nó] không ảnh hưởng đáng
kể đến hình ảnh siêu âm. Tôi nghi ngờ vào thời điểm chất béo thâm nhập, đã có một số thành
phần nhỏ của viêm hiện diện và biến đổi trong vi mạch thấp hơn ngưỡng phát
hiện Doppler.
Doppler sẽ là một công cụ tuyệt vời, bởi vì các tế bào mỡ tiết
ra các yếu tố làm hạn chế lưu lượng máu, khiến vùng này trở nên
thiếu oxy và thúc đẩy sự phát tán của các yếu tố gây viêm, dẫn đến phì đại tế
bào mỡ [adipocyte]. Điều này khác với hiện tượng viêm ở những nơi khác trong cơ
thể.
Các tế bào
mỡ cũng phức tạp như bất kỳ tế bào nào khác.
Béo phì là tiền viêm [proinflammation]. Rất nhiều cơ chế phân tử và di truyền được
xác định đã giải thích cách thức kích hoạt phản ứng viêm. Đối với mục đích của
chúng tôi, nên xem xét bệnh béo phì giống như viêm mãn tính do nhiễm trùng kinh niên ở mức độ thấp . Tôi không biết nếu chất béo tích lũy trong tế bào
gan tăng lên hoặc kích hoạt các gen tiền viêm hoặc liệu từ
các tế bào, gây ra bùng phát phản ứng viêm qua trung gian tế bào.
Kết quả cuối cùng là gan nhiều
mỡ sẽ dẫn đến viêm. Trong gan, các tế bào stellate tiết ra
collagen được kích hoạt bằng cách viêm. Viêm túi mật mạn tính là một tác động
sinh lý ngay trên cơ quan liền kề, là bằng chứng liên hệ giữa béo phì nhiều năm
và bệnh sỏi mật.
Collagen, collagen và collagen
Đã có rất nhiều sự chú ý của siêu âm thương mại đối với chẩn đoán
xơ hóa gan trong vài năm qua, có lẽ vì sự đánh giá cao về hiện trạng tỷ lệ nhiễm viêm gan C cao. Có rất nhiều người béo phì rõ ràng khỏe mạnh, và hậu quả xấu của bệnh béo phì ít gây bức xúc hơn do nhiễm virus.
Bất kể thành kiến về việc ăn quá nhiều carbohydrate hoặc rượu hoặc
lo sợ phơi nhiễm viêm gan siêu vi, mối quan tâm lâm sàng quan trọng là xơ hóa
vì điều đó có thể ảnh hưởng đến không chỉ chất lượng tuổi thọ. Nhiệm vụ của
chúng tôi là xác định trạng thái nguy cơ (như nhiễm mỡ) và đánh dấu sự hiện
diện và mức độ xơ hóa.
Tôi đã luôn coi bài báo này là một trong những tác phẩmsiêu âm cơ bản : Fields S, Dunn F. Correlation of echographic visualizability of tissue with biological composition and physiological state. J Acoust Soc Am. 1973;54(3):809-12. Những gì chúng tôi đang lập bản đồ bằng siêu âm chủ yếu là mô đun đàn
hồi lớn cho các yếu tố thể tích của mẫu của chúng tôi, chủ yếu là số lượng,
loại và cấu trúc vĩ mô của collagen của "mô mềm".
Rất nhiều các mảnh nhỏ của collagen làm nhu mô gan xuất hiện thô
hoặc không đồng nhất và tăng giảm âm rõ . Những gì tôi muốn làm là
phóng đại các vùng nhỏ của nhu mô gan, thường là 5 đến 7 MHz cho mỗi tùy chỉnh
và 15-18 MHz khi đó là thực tế. Xơ được biểu thị bằng các điểm sáng trong
trường nhìn.
Nếu bạn nghĩ elastography là một cách để tăng độ tương phản mô của
độ phân giải chi tiết, và có một số tổng hợp (tức là, độ cứng) mô tả tính trung
bình của tính năng này. Điều này là tốt cho các khu vực rộng lớn, bất thường.
Tôi do dự về điều này là chúng tôi thực sự muốn xác định xơ hóa khi nó là vi
mô, như trong sinh thiết.
Tôi nghi ngờ xơ hóa nhỏ, cùng với các xung và hô hấp, có thể làm thay đổi trong tiếp xúc đầu dò với da , dẫn đến các biến
đổi về các đặc điểm đàn hồi khi lấy mẫu lặp lại nhiều lần tại cùng một vị
trí. Cho dù chúng ta đang sử dụng xung lực bức xạ âm hoặc sóng đàn hồi, hình
ảnh 2D và elastography đều phụ thuộc vào sự truyền sóng siêu âm. Có cách nào để
làm cho thông tin phổ biến này hiển thị rõ hơn trong hình ảnh thông thường
không?
Tăng cường hình ảnh 2D chẩn
đoán trở lại
Có thể sử dụng bất cứ máy
siêu âm nào bạn có, và nó rẻ.
Đánh giá gan và / hoặc xơ
hóa gan bao gồm việc đánh giá cấu trúc mô gan. Có nhiều cách để mô tả cấu trúc
bằng số, nhưng không đơn giản. Mặt khác, mắt và não xử lý ngay lập tức và tốt các
phân phối thống kê 2D.
Đối với hầu hết lịch sử
của siêu âm, không thể truy cập dữ liệu phản xạ thô mà từ đó hình ảnh được hình
thành. Bộ dữ liệu này có phạm vi động rộng hơn nhiều so với màn hình có thể
hiển thị, vì vậy tín hiệu được điều chỉnh trước khi được gửi tới thiết bị hiển
thị (trước đây là màn hình TV).
Một trong những điều thú
vị về các thiết bị kỹ thuật số gần đây hơn là có một tùy chọn để xuất hình ảnh,
là dữ liệu tại hoặc trước thiết bị hiển thị trong thiết bị. Trên một số thiết
bị, đây là một bitmap (tốt nhất) và đối với các thiết bị khác, nó là một JPEG
nén (không thích hợp hơn, nhưng vẫn khá tốt).
Điều đó có nghĩa là bạn
có thể xuất hình ảnh của bạn sang ổ đĩa lưu động và sau đó đưa nó vào bất kỳ
máy tính nào và bạn sẽ làm việc với dữ liệu siêu âm gần đúng và có các tính
năng có thể nhận thấy trong màn hình hiển thị .
Phần tiếp theo là tải
xuống một trong những chương trình xử lý hình ảnh tốt nhất mà bạn có thể tìm
thấy: ImageJ (J là dành cho lập trình Java), được cung cấp miễn phí từ Viện Y
tế Quốc gia Hoa Kỳ (NIH). Tôi thích chương trình này. Nó lên đến phiên bản
1.48, có rất nhiều thói quen, và nó thực hiện gần như ngay lập tức.
Tôi xuất hình ảnh gan
vào máy tính của mình và mở từng ảnh một trong ImageJ. Tôi chọn một khu vực
quan tâm. Thường thì tôi sẽ thay đổi độ sáng và độ tương phản hoặc độ sâu bit
trước khi tôi nhìn vào mô hình kết cấu.
Đây là một dạng đơn giản
của việc tăng cường độ tương phản và giảm nhiễu của phản âm thang xám.
Hình thức hiển thị
mà tôi thấy hữu ích nhất trong việc trình bày cho các bác sĩ
gởi bệnh đến tôi là một hình ảnh 3D có cường độ tín hiệu là chiều cao. Gan nhiễm
mỡ là những đồng cỏ trơn tru, trong khi những chỗ bị xơ hóa là miền núi. Tôi
cũng đọc phân phối thang độ xám làm biểu đồ và tôi sử dụng tùy chọn biến đổi 2D
Fourier để minh họa trực quan hoặc tính toán phân bố của các khoảng cách giữa
các nhóm phản xạ.
Phần kết luận
Bạn đã quyết định gì về trường hợp này? Báo cáo của tôi
là gan nhiễm mỡ (với một vùng bình thường bị ảnh hưởng) với xơ hóa bắt đầu. Điều
này đã được xác nhận mô học.
---------------------------------------------------------------------------------------------
Fellow Ultrasounder,
With obesity becoming epidemic, liver ultrasound has gone from a core competence to an essential component of nearly every abdominal ultrasound exam on patients ranging from preteens to senior citizens.
I am going to start with fatty infiltration (steatosis) as the most common cause of hepatic inflammation that initiates fibrosis, which may progress to clinical cirrhosis. Recognizing liver fat and fibrosis are quintessential tasks for grayscale diagnostic.
Dr. Jason Birnholz.
Such exams are highly dependent on equipment settings, which is why technical progress in this area has been slow to nonexistent since the 1980s, and why, in desperation, there has been a lot of interest in the ultrasound community recently in various forms of elastography.
My own impression is that if you go with the factory presets for liver imaging of any of the recent scanners, you will only be able to handle extreme forms of these conditions and will completely miss the early diagnostic potential inherent to ultrasound.
I am often amused by scientific papers about various forms of MRI for fatty liver. There is usually some sentence to the effect that ultrasound "may have some use, but it is not quantitative," and then a convoluted analysis ends with a few qualitative categories, just like the traditional form of visual grading typical in radiology and pathology.
We all seem to want simple numerical indices for complex issues, and often this is just not possible or practical. MRI is, of course, a great tool, but it does not have the rapid, low-cost ambulatory screening capabilities that ultrasound practitioners employ in other situations every day.
I am going to show you a platform-independent way to improve your ultrasound images and get a lot more information out of them for free with any old computer that is sitting around idle in your facility (or at home).
Fat
A liver is fatty when there is an accumulation of triglycerides within the cytoplasm of hepatocytes, initially as tiny vesicles, some of which will coalesce into larger globules that may displace the nucleus or otherwise distort the cell. All of these vesicles are, obviously, much smaller than the shortest wavelength for the ultrasound transducers used in clinical practice.
The ultrasound findings are due to changes in the nonspecular components of the signal that influence scatter. The typical appearance is a normal size and shaped liver with a normal-appearing vascular architecture that is bright or "greasy" and for which there is no increase in attenuation.
The parenchyma has a lot of fine speckles, and there is increased noise. Typically there is no problem penetrating down to the kidney; liver is also much brighter than renal parenchyma. If you do not have the gain set too high, you will also notice a ring-down type of enhancement distal to hepatic veins.
When there is a negative gradient in properties such as specific gravity between blood in the vessel and fatty infiltrated liver cells surrounding it, the rounded cross-section of a vessel acts like a converging lens, focusing the beam and promoting an increase in backscatter. That may be kind of subtle, but if you see it and the liver otherwise looks normal, you might want to get that patient back sometime and clue in the referring physician that some lab testing (such as serum triglycerides) might be a good idea.
Why is identifying fatty liver a good idea?
There is an obvious association between obesity and fatty liver. When you get a 300-lb plus patient in, you expect to see a fatty liver, but that isn't always the case. Sometimes you will be shocked by seeing what appears to be a fatty liver in someone whose body mass index (BMI) isn't that elevated and in whom there is no history of excessive and prolonged alcohol consumption or other conditions or drug exposures that may also predispose to steatosis.
The common thought is that fatty liver is part of the metabolic syndrome, which emerges clinically after a decade or more of continued subclinical deterioration. Operationally, I think of fatty liver as causing or promoting metabolic syndrome, because it is usually the first thing that you find ultrasonically.
Most of my patients have been women referred for gynecologic issues, and for whatever reason few of them have had routine lab surveillance including cholesterol, triglycerides, or hemoglobin A1C. Incidentally, fatty liver is much more common in men than women.
Early stages of fatty liver are reversible. When I have chubby patients with an ultrasound finding of a fatty liver, I tell them that people who deposit or accumulate fat in the liver are in a high-risk category of subsequently having hypertension and diabetes and the complications associated with those conditions. They usually embrace weight loss and exercise with a lot more seriousness than they had before.
I suspect that in the future, part of the management of fatty liver, with or without other features of the metabolic syndrome, will include drug therapy with an agent such as a statin to limit the inflammatory component that accelerates the clinical deterioration of these patients. There has also been recent interest in the use of curcumin, an active ingredient of the spice turmeric, as a preventive, but there are problems of bioavailability and dosage that need to be resolved.
A precise definition of fatty liver (as fat at or above 5.5% of liver weight) is mandatory for scientific work, but for clinical decision-making, if there is enough intrahepatic fat to be identified by ultrasound, then there is enough to warrant some kind of preventive health intervention. The incidence of fatty liver is now about 15% of the general population in China and 30% in the U.S.
Nonalcoholic fatty liver disease has been predicted to be the No. 1 disease worldwide in less than a decade. A relatively small percentage of fatty liver patients will go on to fibrosis and cirrhosis, but the burden to any healthcare system from metabolic syndrome and its complications will be very great. A routine ultrasound that includes the liver may be the tip-off that the condition is present at a stage when it is treatable.
Diffuse disease, geographic patterns, ethnicity and genetics
My office referral population is a mix of Caucasian and Hispanic (mainly Mexican) patients with smaller African-American and Asian contingents, mostly but not exclusively women, and mainly adults and not children. In terms of fatty liver, its prevalence is disproportionately higher in Hispanic patients (female and male) than in other ethnic groups. This has also been the observation of several serious studies with large patient populations and precise characterization of liver fat.
The naïve thought is to attribute this to diet, but that would be wrong. Plainly, when there is a gross ethnic variation in disease incidence, there must be a genetic factor (or, as usual, factors). A lot has been learned about the genetics of fatty liver in recent years. It's complicated. One reconfirmed finding is that a single nucleotide polymorphism (SNP) for a gene controlling the oxidation of fatty acids has a singularly high incidence in Hispanic populations.
Have a glance at the image below. There is one more related, practical concern for this imaging task. We tend to think of fatty liver as one of the "diffuse" liver diseases, affecting all of the liver uniformly. The first few times you see a rounded, less-reflective "nodule" within a fatty liver, you will assume that this has to be a metastatic lesion, even though the fine detail does not look the way you expect a met to appear.
I can remember doing some ultrasound-guided liver biopsies of such nodules back in the early 1980s. The results always came back "normal liver." Of course we worried that maybe the biopsy missed the lesion, until we learned that these were actually islands of normal liver that had not yet or were somehow resistant to fatty accumulation. The following image has a peripheral zone that has been spared.
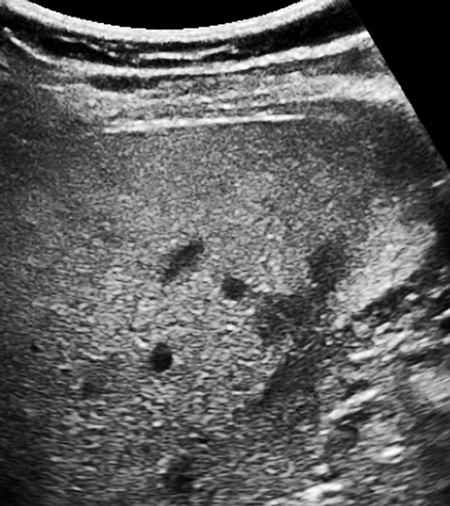
Mild fatty liver in a 42-year-old woman with a more intense patch posteriorly in the right lobe adjacent to spared peripheral patches. All images courtesy of Dr. Jason Birnholz.
Since the 1990s and mainly via CT scans, it has been known that fatty livers can have a geographic pattern with various zones of fatty and normal tissue. I once saw a right lobe that looked like a yin-yang sign with a bright top and a curved border over a normal lower section. The reason I mention this is that when the issue is an SNP, you will have a diffuse pattern when all of the cells are afflicted and something very different when there is a genetic mosaic.
This has been well-recognized in dermatology, when skin manifestations of systemic diseases occur in patches or along dermatomes. The rash is expressed in those cells having the bad SNP. What this comes down to is a more basic question of how diffuse or geographic an infiltration really is.
This becomes important when we try to sample a small part of the liver with a biopsy or some region-of-interest application such as elastography. How much and how often do we need to sample? You can probably answer that for advanced tumor disease, but it can be tricky for potentially geographic situations such as fatty or fibrotic liver.
Adipocyst activity
I do not intend to say much about the second stage of liver deterioration, which is inflammation. Inflammation per se does not seem to influence ultrasound images appreciably. I suspect that by the time we are reasonably certain of fatty infiltration, there is already some small component of inflammation present and that any changes in the microvasculature are well below Doppler detection thresholds.
Parenthetically, really sensitive Doppler would be a fantastic tool, because fat cells in obesity secrete vasoactive factors that limit blood flow, making the region hypoxic and promoting the release of inflammatory factors, leading to adipocyte hypertrophy. This is contrary to what we expect with inflammation elsewhere in the body.
To me, the major lesson of molecular biology and genomic medicine is how unbelievably complex physiologic and pathophysiologic processes are. Fat cells are as complex as any other. As an imager, if I happen to know that in obesity there are increased circulatory levels of leptin from adipocytes and that leptin promotes cardiac hypertrophy, then I have a reason to include left-ventricular wall thickness in my survey when a patient with a high BMI comes in.
I'm not personally wild about the way the term "holistic" is thrown about, but as imagers concerned with early diagnosis and prevention, I do not think we can afford the luxury of single-organ or single-region viewing.
Obesity is proinflammatory. A lot of molecular and genetic mechanisms have already been identified explaining how inflammatory responses are triggered. For our purposes, we should consider obesity identical to chronic inflammation from some low-level persistent infection. I do not know if fat accumulated in liver cells upregulates or activates proinflammatory genes or whether the changes result from cells bursting, causing a cellularly mediated inflammatory response.
The end result is that a lot of liver fat will eventually lead to inflammation. Within the liver itself, collagen-secreting stellate cells are activated by inflammation. Chronic focal cholecystitis is a pathophysiologic effect on an immediately adjacent organ, which is a big link in the association between obesity for many years and eventual cholelithiasis.
Collagen, collagen, and collagen
There has been a lot of commercial ultrasound attention to the diagnosis of liver fibrosis in the past few years, perhaps because of our current appreciation of the high prevalence of hepatitis C exposure. There are so many plainly healthy obese people around, and the ill consequences of obesity can be far enough removed in time that the popular appreciation of the problems of this condition are somehow considered less pressing than a viral exposure.
No matter what your emotional biases may be about overindulgence in carbohydrates or alcohol or fears of viral hepatitis exposure, the clinically important concern is fibrosis because that can affect the length of life, not just its quality. Our tasks are to identify a risk state (like steatosis) and to grade the presence and extent of fibrosis.
I have always regarded this paper as one of the foundational works for all of ultrasound: Fields S, Dunn F. Correlation of echographic visualizability of tissue with biological composition and physiological state. J Acoust Soc Am. 1973;54(3):809-12. What we are mapping with ultrasound is mainly the bulk modulus of elasticity for the volume elements of our sampling, which is mainly the amount, type, and macrostructure of the collagen endoskeleton of "soft tissues."
Lots of tiny patches of collagen make liver parenchyma appear coarse or heterogeneous and attenuation is increased markedly. What I like to do is to make magnification views of small regions of hepatic parenchyma, usually 5 to 7 MHz per custom and at 15 to 18 MHz when that is practical. Fibrosis is indicated by bright spots in the field-of-view.
If you think about it, elastography is a way to increase tissue contrast at the expense of detail resolution, and there is a composite number (i.e., stiffness) that characterizes an average of this feature. This is fine for large, uniformly abnormal regions. My hesitation about this is that we really want to identify fibrosis when it is microscopic, as in a biopsy.
I suspect that subtle variations in the extent of fibrosis, along with vascular pulsations and breathing, possibly also variations in transducer skin contact, lead to variations in elastographic features when the sampling is repeated multiple times at the same place. Whether we are using radiation pressure or shear-wave elastography, 2D imaging and elastography are both dependent on ultrasound wave propagation. Is there some way of making this common information more visible in conventional images?
Enhancing the diagnostic return of a 2D image
This is the finesse part, but I think this solution is sort of elegant. It uses whatever ultrasound system you have, and it is cheap.
Evaluating fatty and/or fibrotic livers involves assessing tissue texture, like distinguishing the woven pattern of cloth from the surface pattern of polished marble. There are ways to characterize textures numerically, but they are not simple. On the other hand, the eye and brain handle these second- and third-order 2D statistical distribution tasks instantly and well.
For most of the history of ultrasound, it has not been possible to access the raw reflectivity data from which the image is formed. This dataset has a much broader dynamic range than monitors can display, so the signal is conditioned before it is sent to the display device (previously a TV monitor).
One of the cool things about more recent digital devices is that there is an option for exporting the images, which are data at or prior to the display device in the equipment. On some devices this is as a bitmap (that's best) and for others it is as a compressed JPEG (not preferable, but still pretty good).
What that means is that you can export your images to a jump drive and then bring it to any computer, and what you will be working with is pretty close to raw ultrasonic data and for which there are features that may be perceptible in the visualized display.
The next part is to download one of the best image processing programs you can find: ImageJ (the J is for the Java programming), which is provided for free from the U.S. National Institutes of Health (NIH). I love this program. It is up to version 1.48, there are a lot of routines, and it executes almost instantaneously.
I export liver images into my computer and open them one at a time in ImageJ. I select a region of interest. Often I will alter the brightness and contrast or bit depth before I look at the texture pattern.
This is a simple kind of contrast-enhancing and noise-reducing form of grayscale remapping. The real beauty of this preconditioning of images is in additional semiquantitative routines.
One form of display that I find most helpful in presenting cases to my referring physicians is a 3D picture with signal strength as height. Fatty livers are smooth prairies, while fibrotic ones are mountainous. I also read out the grayscale distribution as a histogram, and I use the 2D Fourier transform option to illustrate visually or to calculate the distributions of spacings between groups of reflectors. I regret that there is not enough space in this column to go into that more fully.
Below are images of another patient.

Broadband 6-MHz liver image with a 78 x 114-pixel region of
interest.

Z-axis display of peak amplitude in the region of interest.

The histogram distribution of grayscale levels in the region
of interest.
What have you decided about this case? My report was of fatty liver (with a spared normal region) with the beginning of fibrosis. This was confirmed histologically.
I started a little feasibility project that included 50 patients for whom I was able to get some additional clinical and lab information. There was excellent separation of normal livers, fatty livers, and those with fibrosis on visual criteria alone. The standard deviation in the grayscale histogram was the best single numerical discriminator and grader. Ultrasound elastography was not contributory. To be fair, I was seeing healthy ambulatory outpatients, which is pretty far removed from inpatients with established and advanced liver disease.
At some point, I suppose the manufacturers will start to look at ways of extracting quantitative information from preimage data in conventional scanners. In the meantime, this is a simple way to spiff up your appreciation of grayscale features in images.
What I know is that any techniques or technical tricks that focus you on making the best images and on getting the most info out of them can only make you a better ultrasounder. This is true for any application. Try ImageJ on a region of interest of an anterior placenta with a 15- or 18-MHz probe, for example, and you will make this a part of every third-trimester obstetric exam you do subsequently.
Xem lại một bài viết cũ về sử dụng histogram cường độ siêu âm để đánh giá gan thấm mỡ.
NHÌN
LẠI SIÊU ÂM GAN THẤM MỠ
NGUYỄN
THIỆN HÙNG
Trung
tâm Y khoa MEDIC
Thành
phố Hồ Chí Minh
Gan thấm mỡ (hepatic steatosis) nằm
trong nhiều bệnh cảnh lâm sàng, nhưng bệnh gan do rượu là nguyên nhân gan thấm
mỡ thường gặp nhất tại Bắc Mỹ. Gan thấm mỡ cũng được ghi nhận trong hơn 50%
bệnh nhân tiểu đường.
ĐỊNH NGHĨA
Gan thấm mỡ được định nghĩa do ứ đọng
triglycerid quá nhiều trong sinh chất tế bào gan dưới dạng không bào lớn hay
nhỏ. Gan thấm mỡ diễn tả cả đáp ứng không chuyên biệt của tế bào gan bị tổn thương
lẫn một mặt của xáo trộn chuyển hóa tổng quát.
Là quá trình có thể phục hồi được.
THỂ LÂM SÀNG
Gan thấm mỡ có nhiều biểu hiện lâm
sàng.
Thoạt đầu gan thấm mỡ “câm” có thể
biểu hiện như gan lớn nhẹ không triệu chứng khi khám thường quy bệnh nhân béo
phì hay tiểu đường hay bệnh nhân đang điều trị corticoid hay hóa trị. Trong
nhóm này chức năng gan thường là bình thường. Kế đến, đau hạ sườn phải mơ hồ và
cảm giác tức kèm theo gan to giúp xác định gan thấm mỡ của bệnh nhân uống rượu
hoặc không uống rượu, men gan transaminase và dự trữ kiềm có thể tăng trong nhóm này. Cuối cùng gan
thấm mỡ cấp có thể gây vàng da tuy hiếm, tổn thương gan cấp và bệnh não (do
hepatotoxins, gan thấm mỡ cấp ở người có thai).
HÌNH ẢNH SIÊU ÂM
Gan thấm mỡ sinh echo rất nhiều trên
siêu âm B-mode. Các dấu hiệu siêu âm gồm: tăng sinh echo chủ mô gan, vách mạch
máu mờ, tăng giảm âm và khó thấy các phần sâu và sát cơ hoành, và gan lớn.
Có 3 mức độ: nhẹ, tăng echo nhẹ lan
tỏa, còn thấy cơ hoành và vách mạch máu trong gan; trung bình, tăng echo trung bình và mờ cơ hoành và vách mạch máu;
nặng, tăng echo rõ ràng, xuyên thấu kém
ở các phân thùy sau gan phải và kém hay không còn thấy vách mạch máu và
cơ hoành.
Gan thấm mỡ khu trú là mỡ khu trú
trong gan có echo, có thể có dạng khối nhưng thường có đường viền dạng bản đồ,
và không làm dời chỗ mạch máu đi qua.
Gan thấm mỡ không hoàn toàn thường là
những vùng echo poor quanh tĩnh mạch cửa, thùy đuôi và quanh hố túi mật, đôi
khi cần CT xác định lại.
Siêu âm thường không nhạy đối với
gan thấm mỡ hạt nhỏ.
Khó phân biệt về siêu âm giữa gan thấm
mỡ và xơ gan phản ánh các tiêu chuẩn siêu âm bị trùng nhau và cùng có các tiến
trình trên cùng bệnh nhân.
VẤN ĐỀ:
1. Gan thấm mỡ độ nhẹ thường bị bỏ sót.
2. Viêm gan mạn cũng có giảm âm phần sâu.
3. Không phân biệt được bằng siêu âm các nguyên nhân của
gan thấm mỡ.
4. Không phân biệt được bằng siêu âm gan thấm mỡ và các
loại viêm gan khi có tăng men gan.
ĐỐI TƯỢNG:
2
nhóm:
a)
Nhóm 1: Gồm 101 bệnh nhân (46 nam và 55 nữ), từ 30 - 79
tuổi.
b) Nhóm 2: Gồm
199 ca, có 127 ca (72 nữ, 55 nam) có làm
histogram cường độ siêu âm gan thận.
PHƯƠNG PHÁP:
•
1/ Khảo sát tiền cứu= chẩn đoán siêu âm trước rồi thử
triglycerids (TG), cholesterol (CT), và
theo dõi men gan AST và ALT (GOT và GPT). Cùng một người khám siêu âm, đầu dò sector 5 MHz, máy
KONTRON SIGMA 1.
2/ Lô 127 ca (72 nữ, 55 nam) có
làm histogram cường độ siêu âm gan và thận.
•
3/Tiêu chuẩn chẩn đoán siêu âm :
-
gan to (gan trái lớn hơn 10cm qua mặt cắt dọc qua động mạch chủ bụng, gan phải
lớn hơn 15cm qua mặt cắt gian sườn ở bình diện thận phải).
- mờ vách tĩnh mạch cửa, chỉ chọn các vách giảm echo nhánh xa (gan thấm mỡ độ nhẹ)
và giảm echo vách các nhánh chính
(độ vừa).
KẾT QUẢ
1/ Thành phần bệnh nhân gan thấm mỡ: béo phì
(25,74%), tiểu đường (18,81%), rượu (06,93%), thuốc corticoid và tương tự
(0,99%), ăn chay (02,97%)
2/ Đa số gan thấm mỡ độ nhẹ (76,24%) còn lại độ vừa
(19,8%).
3/ Đa số đều tăng TG (59,40% và 66,39%) và có tăng CL
(66,33% và 72,27%)
Một số có tăng
men gan (gấp 3 trị số bình thường) (41,79%)
Một số dương
tính giả (22/101 và 4/67)
5/
Bình quân độ chênh lệch histogram cường độ siêu âm gan thận 101 ca gan thấm mỡ
là 730/101 = 7,22.
KẾT LUẬN:
1/ Siêu âm chẩn đoán gan thấm mỡ đối chiếu với kết quả
sinh hóa có độ chính xác là 78,21%.
2/ Đa số nguyên nhân gan thấm mỡ của 2 lô nghiên cứu là
béo phì và tiểu đường. Nhưng khó xác định được nguyên nhân vì có nhiều yếu tố
ảnh hưởng cùng lúc (nội tiết, dinh dưỡng, rượu, viêm nhiễm…).
3/ 41,79% có tăng men gan kèm theo tăng TG và CL gợi ý
quá trình gan thấm mỡ diễn biến đã lâu, và cần thiết phân biệt với viêm gan do
nhiều nguyên nhân khác nhau (viêm gan mỡ, steatohepatitis).
Tài
liệu tham khảo chính:
1.
IRWING, HC. : Diffuse Liver Disease, pp. 295 - 307, Clinical Ultrasound (Vol.
1), Churchill Livingstone, 1st ed., 1993.
2.
KURTZ: Ultrasound, ACR, CD-ROM, 1994.
3. LAUFER I, MESSMER JM: Gastroenterology, ACR, CD-ROM,
1990.
4. NGUYỄN
THIỆN HÙNG - PHAN THANH HẢI : Siêu âm khảo sát Gan thấm mỡ. Siêu âm ngày nay số 11/1997.
5.
Radiology On Line
6.
Medscape Gastroenterology On Line.
7.
WITHERS CE: The Liver, Ultrasound
Categorical Course Syllabus, RSNA 1991.
Không có nhận xét nào :
Đăng nhận xét